Build this if
Your team repeatedly loads local GeoJSON or shapefile data, runs spatial SQL, and needs to share interactive map views without exposing data to third-party cloud GIS platforms.
A browser-based geospatial workspace where analysts import local spatial files, style layers on an interactive map, run spatial SQL via DuckDB-WASM, and share projects as embeddable links—all without uploading data to a remote server.
Decision snapshot
Your team repeatedly loads local GeoJSON or shapefile data, runs spatial SQL, and needs to share interactive map views without exposing data to third-party cloud GIS platforms.
Your users require server-side geoprocessing on datasets larger than browser memory can handle, or need full desktop GIS feature parity like advanced topology tools.
Recruit 5 GIS analysts, give each a 50 MB GeoJSON file, and measure whether they can import, style, run one spatial SQL query, and generate a shareable embed link within 10 minutes.
Problem and target customer
Spatial analysis workflows are fragmented across desktop GIS, browser maps, and notebooks. Analysts cannot easily load local geospatial files, run spatial SQL, style results, and share an interactive map project in one tool without sending sensitive data to a remote cloud.
GIS analysts and data scientists in organizations that handle sensitive location data and need a portable, local-first workspace for ad-hoc spatial analysis and map sharing.
Free local-first workspace for individual analysts; paid team workspaces for managed project storage, share links, access controls, and usage-based tile and data delivery.
Editorial note
GeoLibre is a local-first geospatial workspace for analysts who need to inspect, query, style, and share spatial data without moving raw files into a hosted GIS by default. The first product loop is deliberately narrow: import a dataset, style its layers, run spatial SQL, and share a project when collaboration is needed.
The commercial product is a team workspace, not the local map editor. Individual users can stay on the local workflow, while teams pay for managed project storage, access controls, shareable embeds, and hosted tile or data delivery. Storage and delivery volume are the clearest usage meters because they grow with the value consumed.
The MVP should validate the import-to-share loop on browser-sized datasets before adding server-side geoprocessing, 3D tiles, desktop parity, or a plugin marketplace.
Choose your next step
Evaluate the operating tradeoffs quickly, or inspect how to build the MVP.
Compare the three operating paths at the default workload before opening the full calculator.
See cost preview Build this ideaInspect the build blueprintReview MVP scope, workflow, states, data rules, architecture, and acceptance criteria.
Open blueprintEvaluation preview
Directional infrastructure estimates for the current 500 data layers assumption. Open the full calculator when you are ready to change it.
Managed app, database, and worker capacity for the beta workload.
Lowest operating effortA lower fixed-cost deployment with more setup and maintenance.
Lowest baseline costMore control over service placement and operational capacity.
Most separation and controlBuild blueprint
Product goal
MVP scope
UX and user flow
Main interface with map canvas, layer sidebar, SQL console, and attribute table.
Drag-and-drop zone for GeoJSON and GeoParquet files with geometry type detection.
Controls for fill color, stroke width, stroke color, and opacity per layer.
Code editor for DuckDB-WASM spatial SQL queries with result preview as derived layer.
Generates embeddable link by serializing project state to managed storage.
Core entity outline
Top-level container for layers, styles, queries, and share state.
Represents an imported or derived spatial dataset rendered on the map.
Stores visual styling properties for a layer.
Stores a DuckDB-WASM SQL statement and its result layer reference.
Serialized project state stored in managed backend for embeddable access.
Architecture and data flow
Renders split-pane UI, manages panel state, and coordinates user actions across map, console, and table.
Displays interactive vector map, applies layer styles, and handles pan, zoom, and feature selection.
Loads imported spatial data into in-browser tables, executes spatial SQL queries, and returns result geometries.
Parses GeoJSON and GeoParquet files, detects geometry type, and registers layers in the DuckDB-WASM instance.
Receives serialized project state, persists layer metadata and styles, and serves read-only embed views.
Deliverables and acceptance
Recommended stack
Component-driven UI for split-pane workspace with map canvas, SQL console, and attribute table panels.
Open-source interactive map renderer with styling support and vector tile display, matching the local-first philosophy.
In-browser analytical SQL engine with spatial extension, enabling local-first queries without server round-trips.
Deploys managed storage API for shared project serialization and embeddable link generation.
Optional webhook handler that triggers project link generation and notifies team channels when a project is shared.
React provides the component structure for a multi-panel geospatial workspace. MapLibre GL JS handles interactive vector map rendering with full styling control. DuckDB-WASM runs spatial SQL entirely in-browser, preserving the local-first privacy differentiator. Railway hosts the lightweight managed storage API for shared projects. Make is optional glue for share notifications, not core functionality.
Copy the build prompt, model the operating cost, and choose where to deploy.
Execution
Once the blueprint is clear, use the prompt, cost model, and deployment options to start building.
Build prompt
lovable
Build prompt
Open the prompt pack whenever you are ready to take this blueprint into your builder.
Build prompt ready
Copy the prompt into your builder, then use the cost model below to choose how you want to run it.
Use the cost model to choose a deployment path that matches the build plan.
Cost calculator
A technical run-cost estimate for the first production version. Team, acquisition, payment fees, and business COGS are excluded.
$1.02-$5.25 per 100 data layers
Low and high values allow for usage variance and plan headroom.
Managed app, database, and worker capacity for the beta workload.
1K data layers included, then $5-$20 per 1K data layersLayer loading, spatial SQL, and analysis work driven by dataset volume.
0 included, then $0.02-$0.25 per 100 data layersThe estimate combines the selected infrastructure path, required operating modules, selected optional modules, and usage above included monthly allowances. Taxes and regional uplifts are excluded.
Deployment options
Choose based on operating preference, not only the headline price.
Run the web app, database, and background jobs with a small operational footprint.
Service usage and background workloads can exceed the base plan.
Run the app, worker, and database on one small Vultr VPS with Docker Compose and explicit backups.
You manage more setup, backups, monitoring, and upgrades.
Separate application, worker, data, storage, and backup responsibilities as the workload grows.
Security updates, backups, observability, and scaling remain your responsibility.
Start building
Build the React split-pane interface with a MapLibre map canvas, layer sidebar, SQL console, and attribute table panel. Wire local file import to register layers and render geometries.
Open Lovable 02AutomationShare webhook automationOptionally configure a Make scenario that listens for project-share webhooks from the Railway API and posts a notification with the embed link to a Slack or Teams channel.
Open Make 03DeployManaged project storage APIDeploy a lightweight Node or Python API that accepts serialized project state, stores layer metadata and style definitions, and returns an embeddable read-only project link.
Open RailwayKeep exploring
SaaS WorkflowBusiness Operations
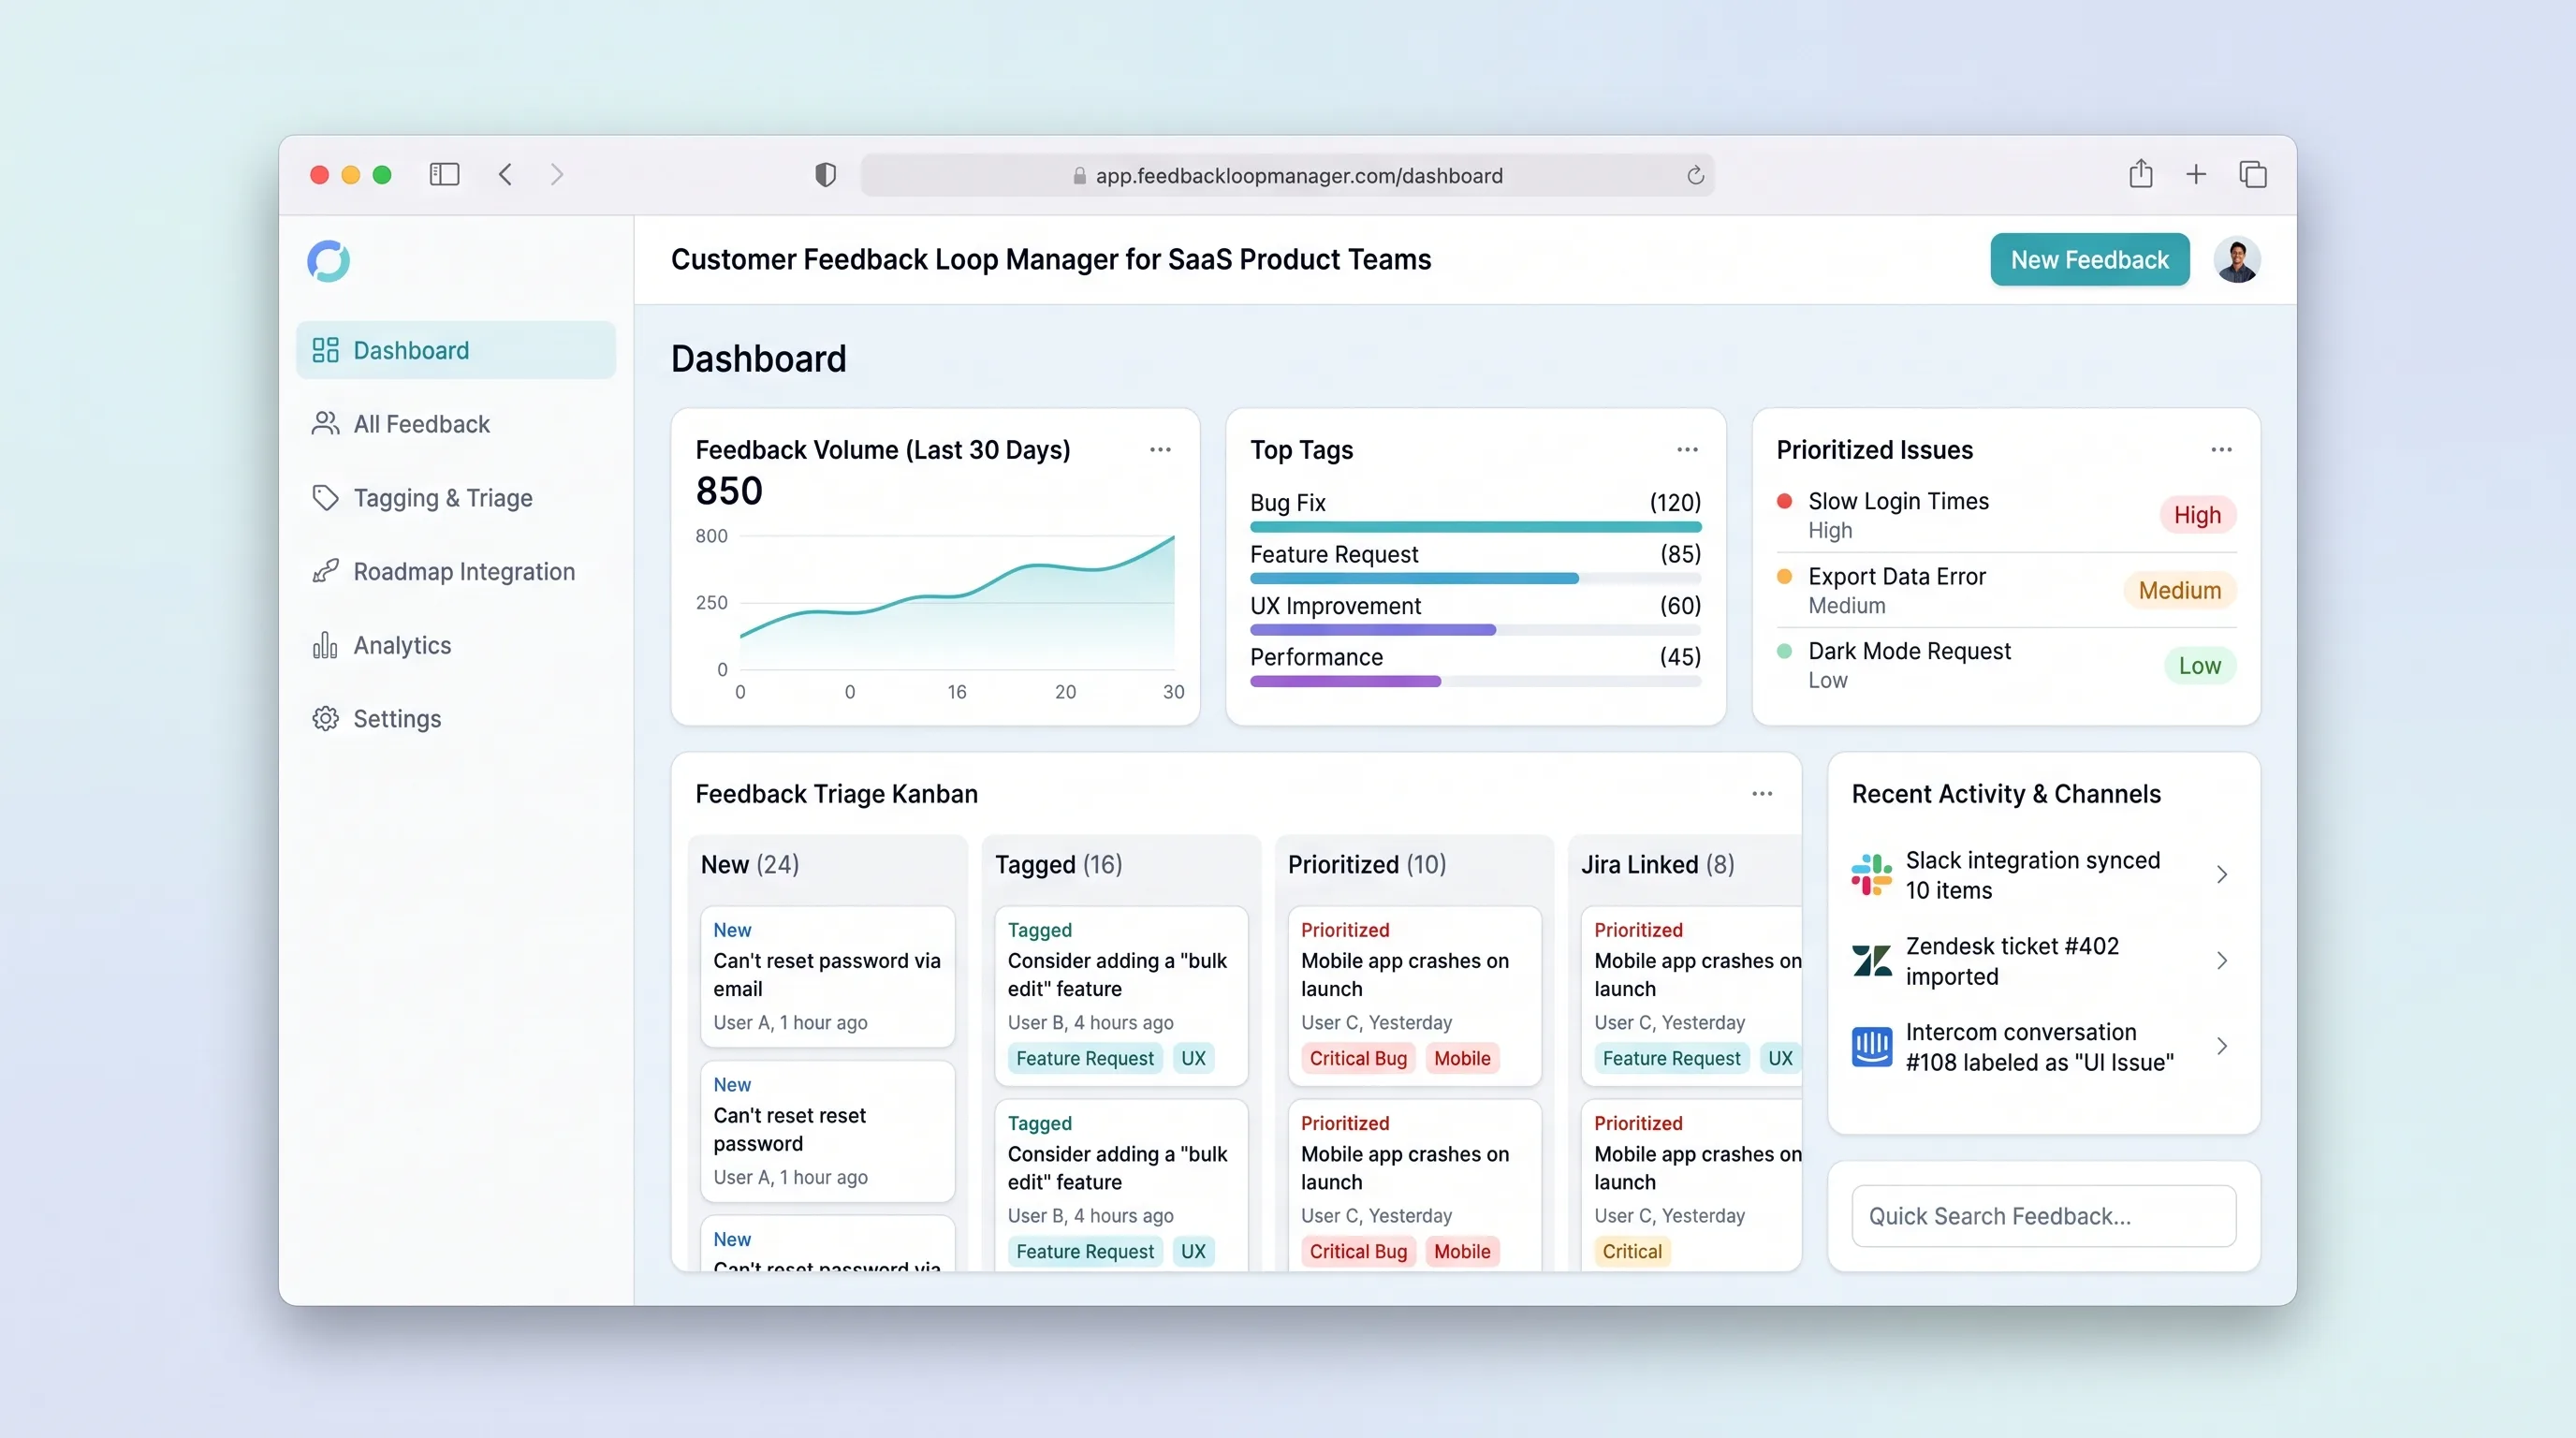
Collect, tag, and prioritize user feedback from multiple channels into a single prioritized backlog that feeds roadmap decisions with traceable evidence.
SaaS WorkflowBusiness Operations
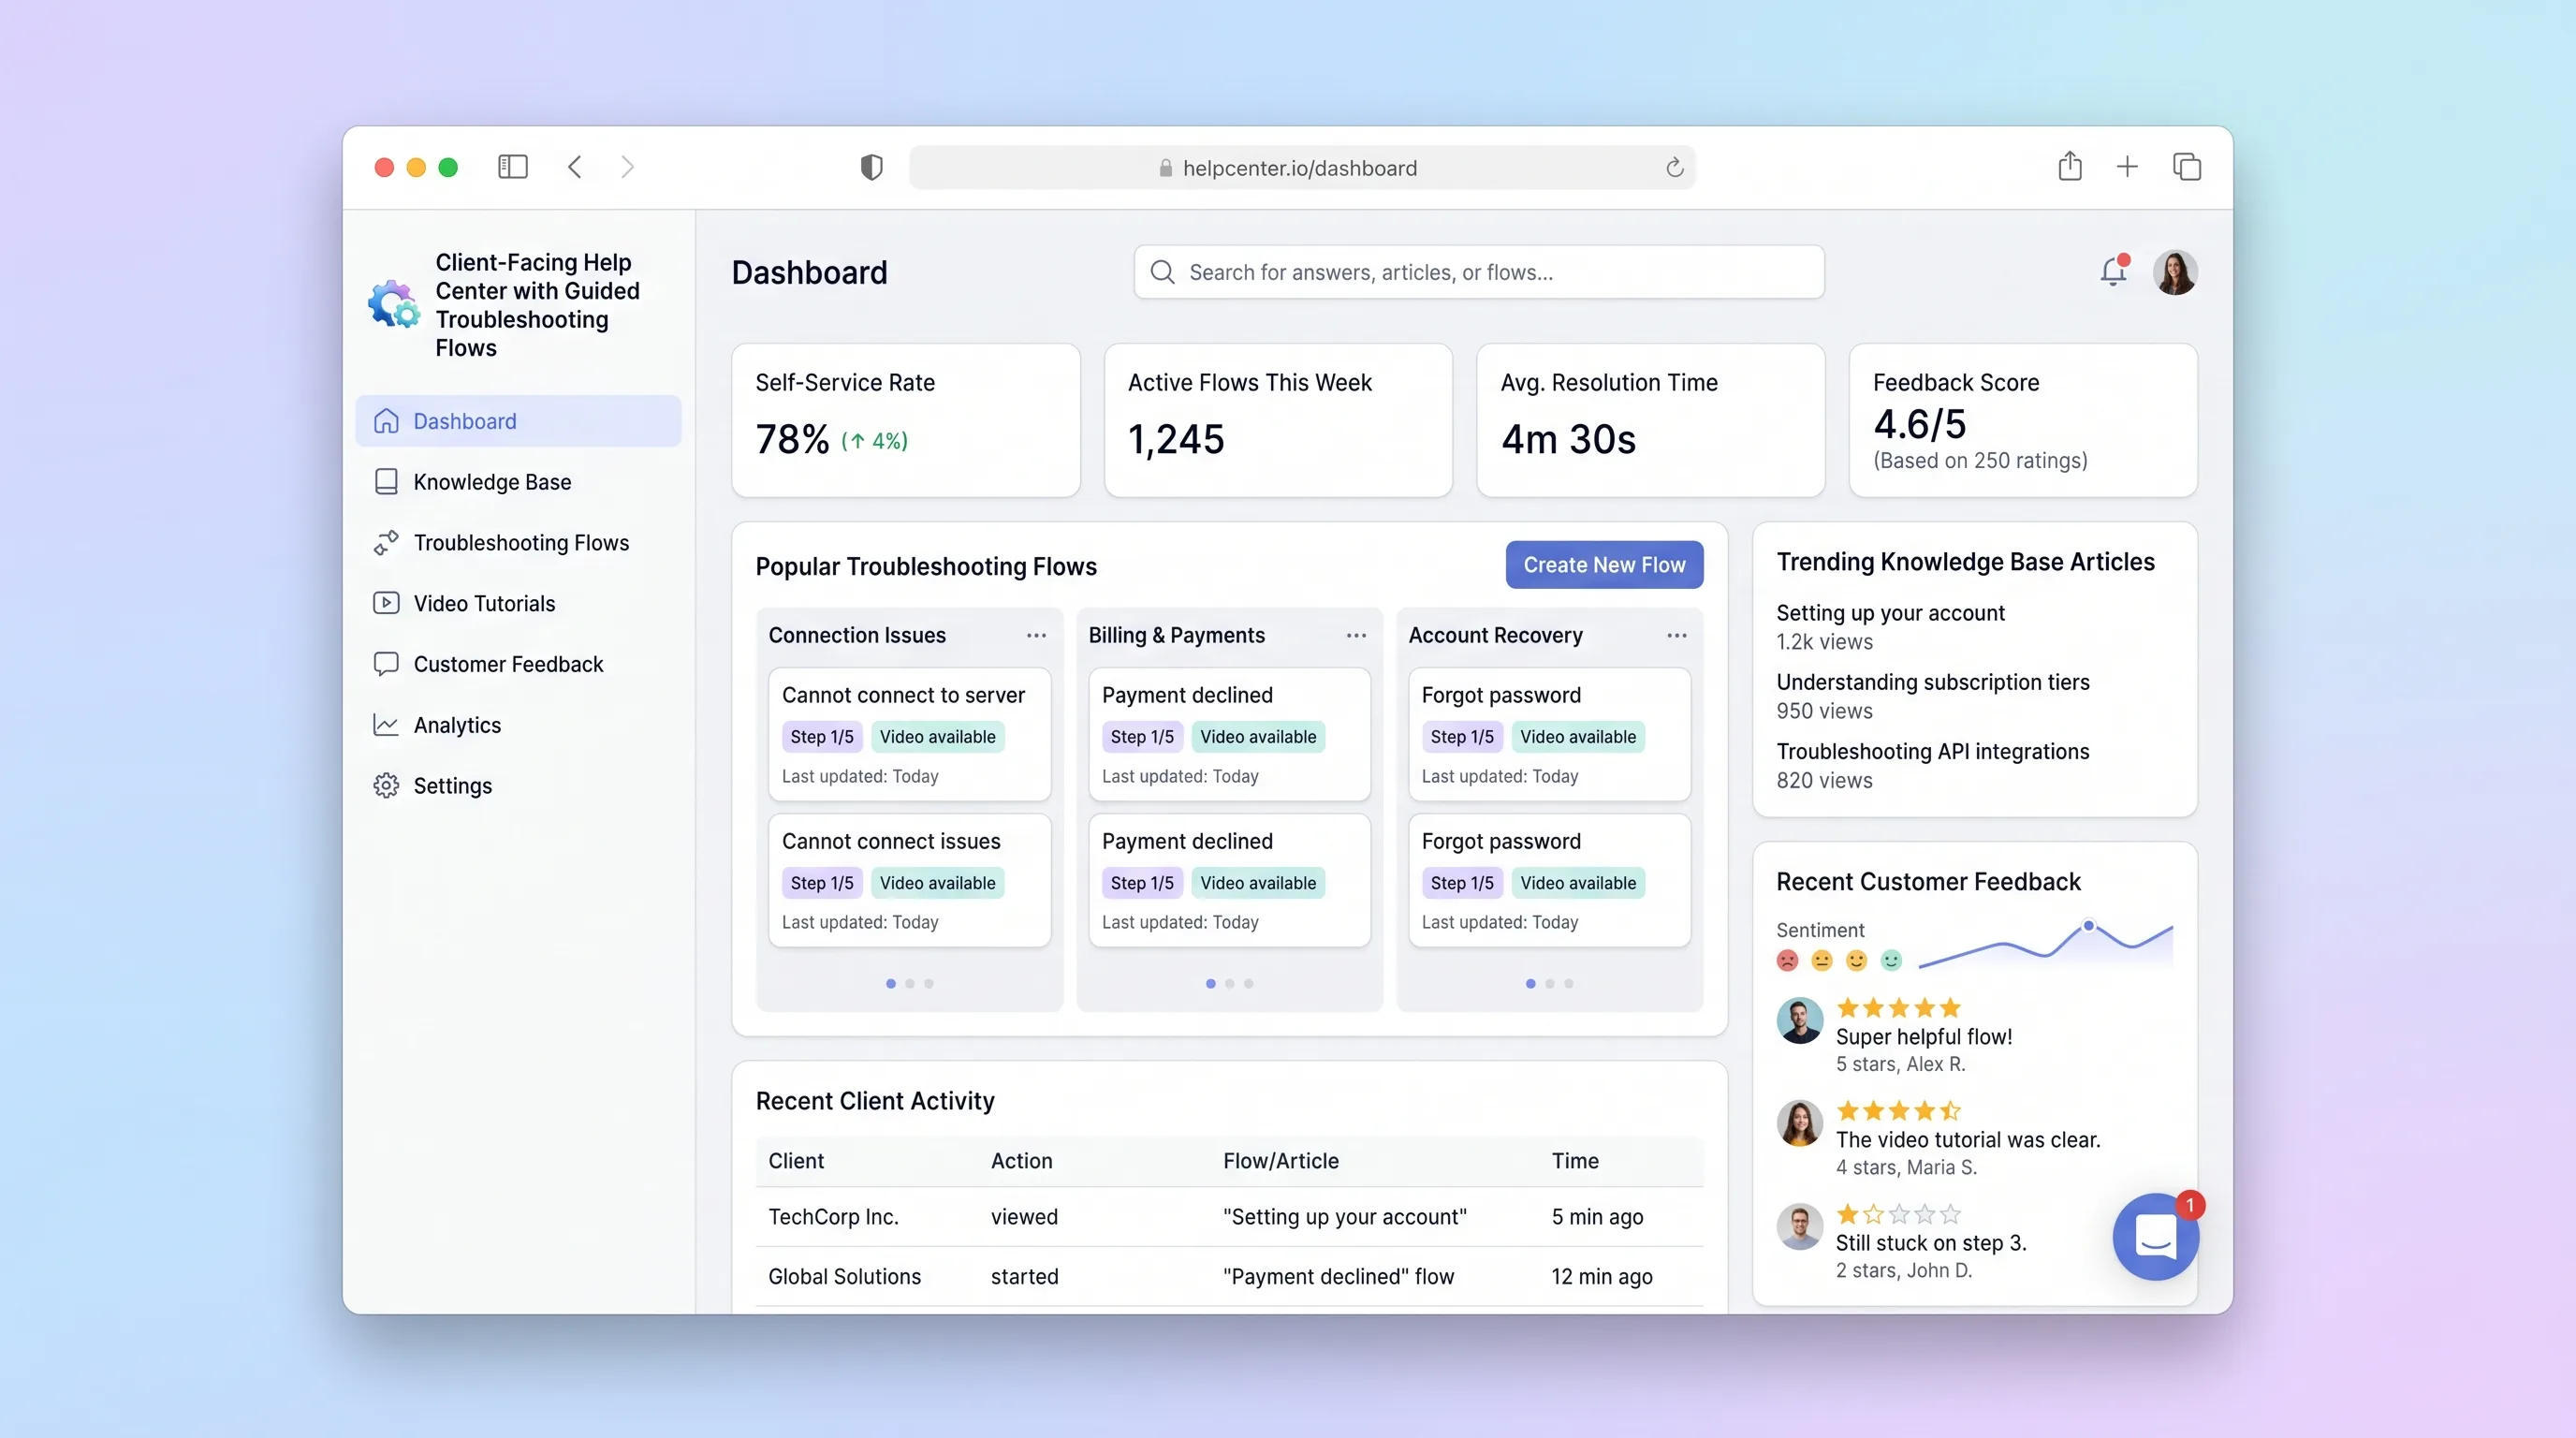
A self-service help center where SaaS teams publish interactive troubleshooting wizards and knowledge articles, and end customers resolve issues through guided step-by-step flows with built-in feedback capture.
SaaS WorkflowBusiness Operations
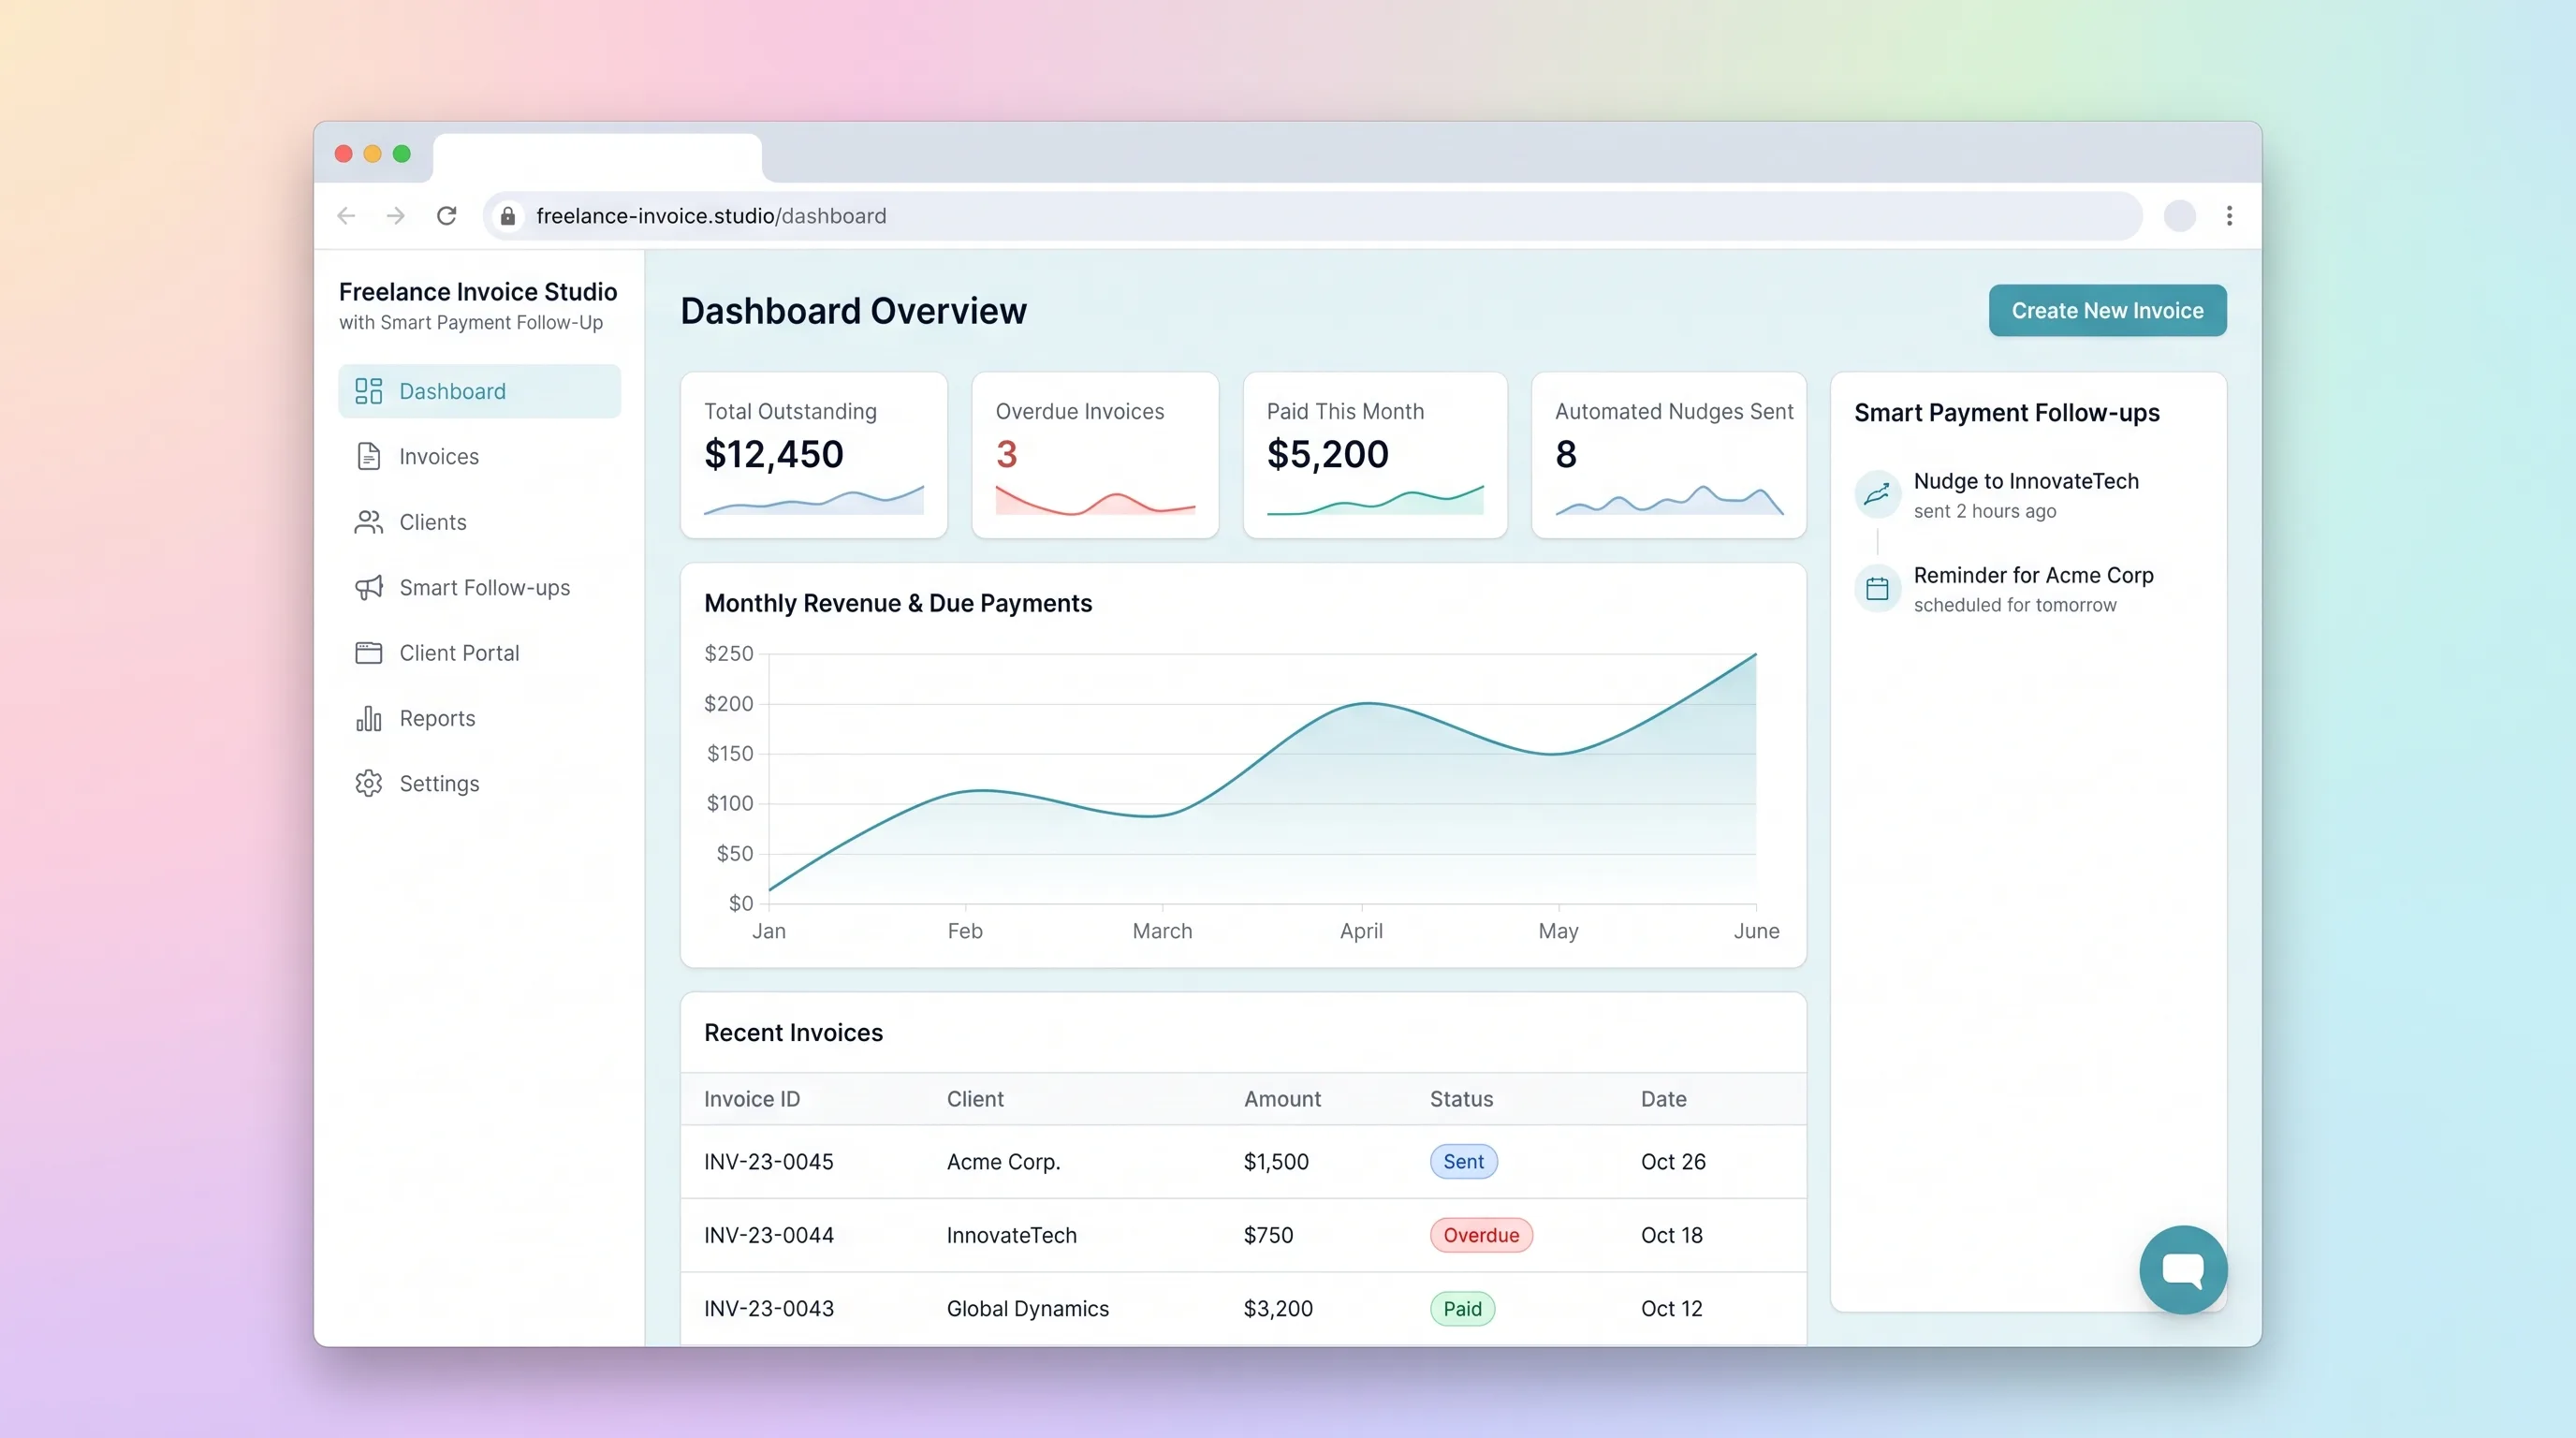
A focused invoicing workflow for freelancers to create, send, and track invoices with automated late-payment reminders and a client-facing payment portal.
SaaS WorkflowProfessional Services
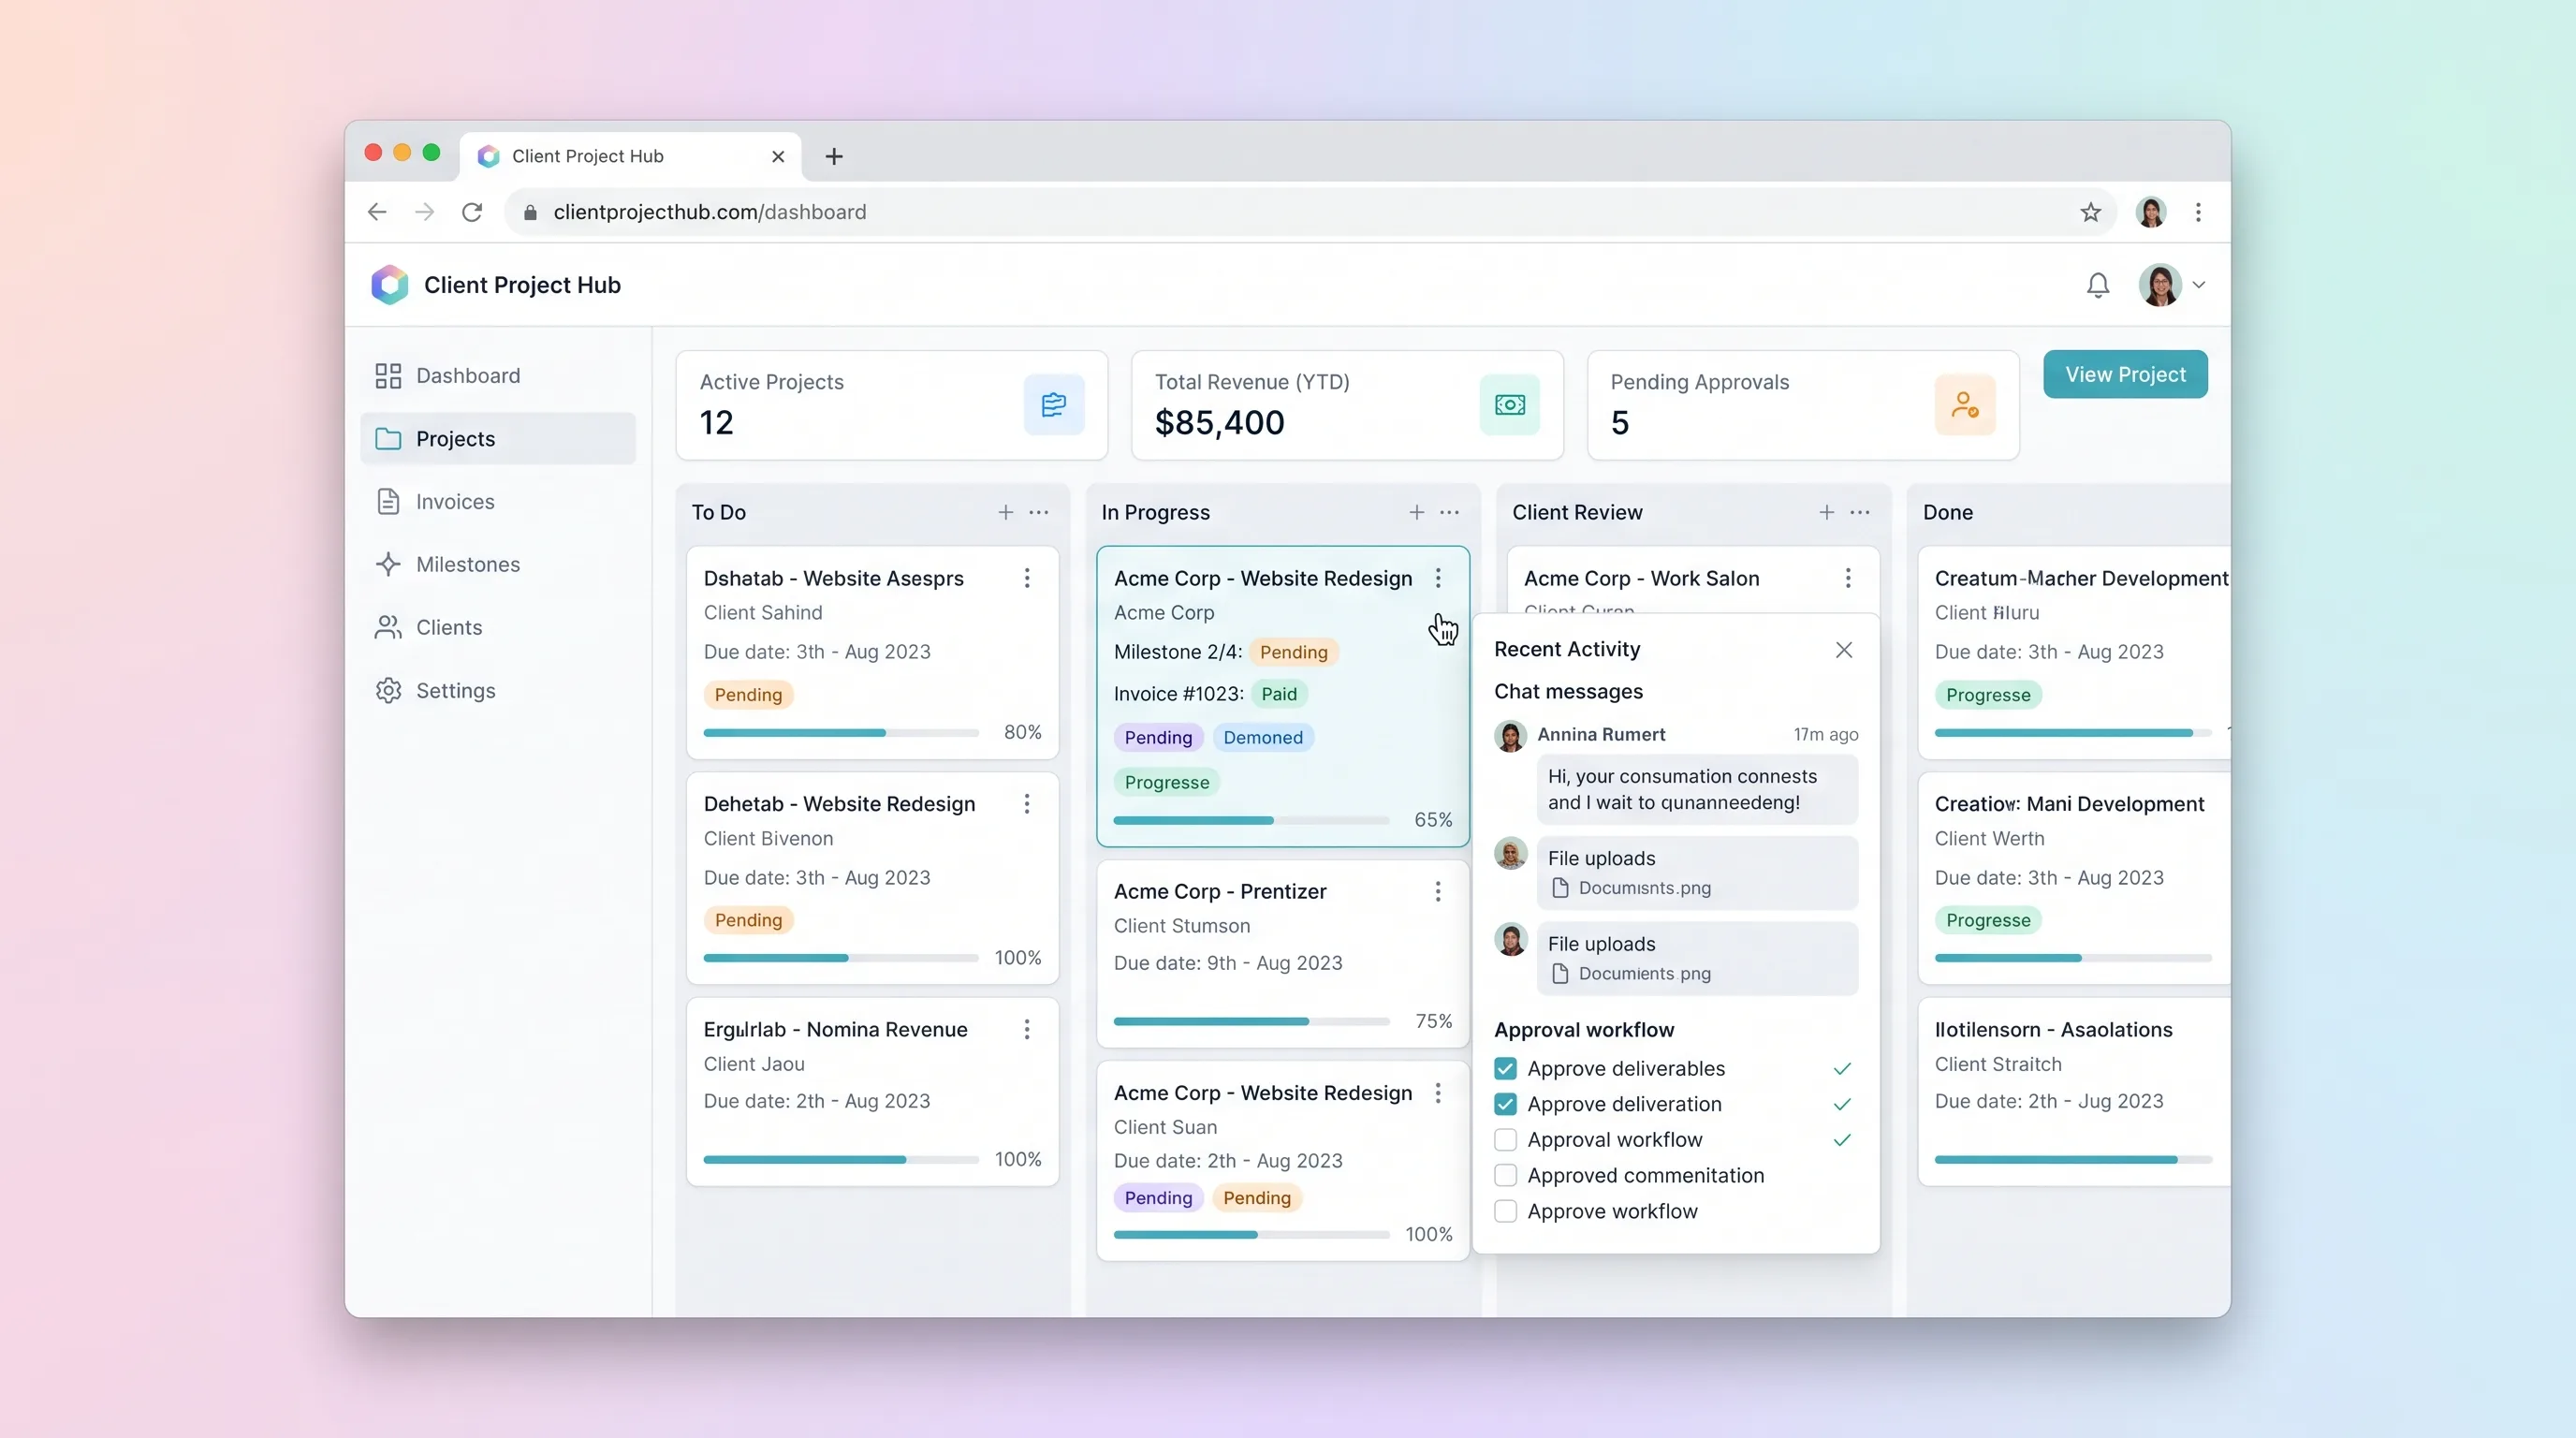
A kanban-driven workspace where freelancers and small agencies track client project milestones, route deliverables through an approval workflow, and auto-generate invoices upon approval.
SaaS WorkflowProfessional Services
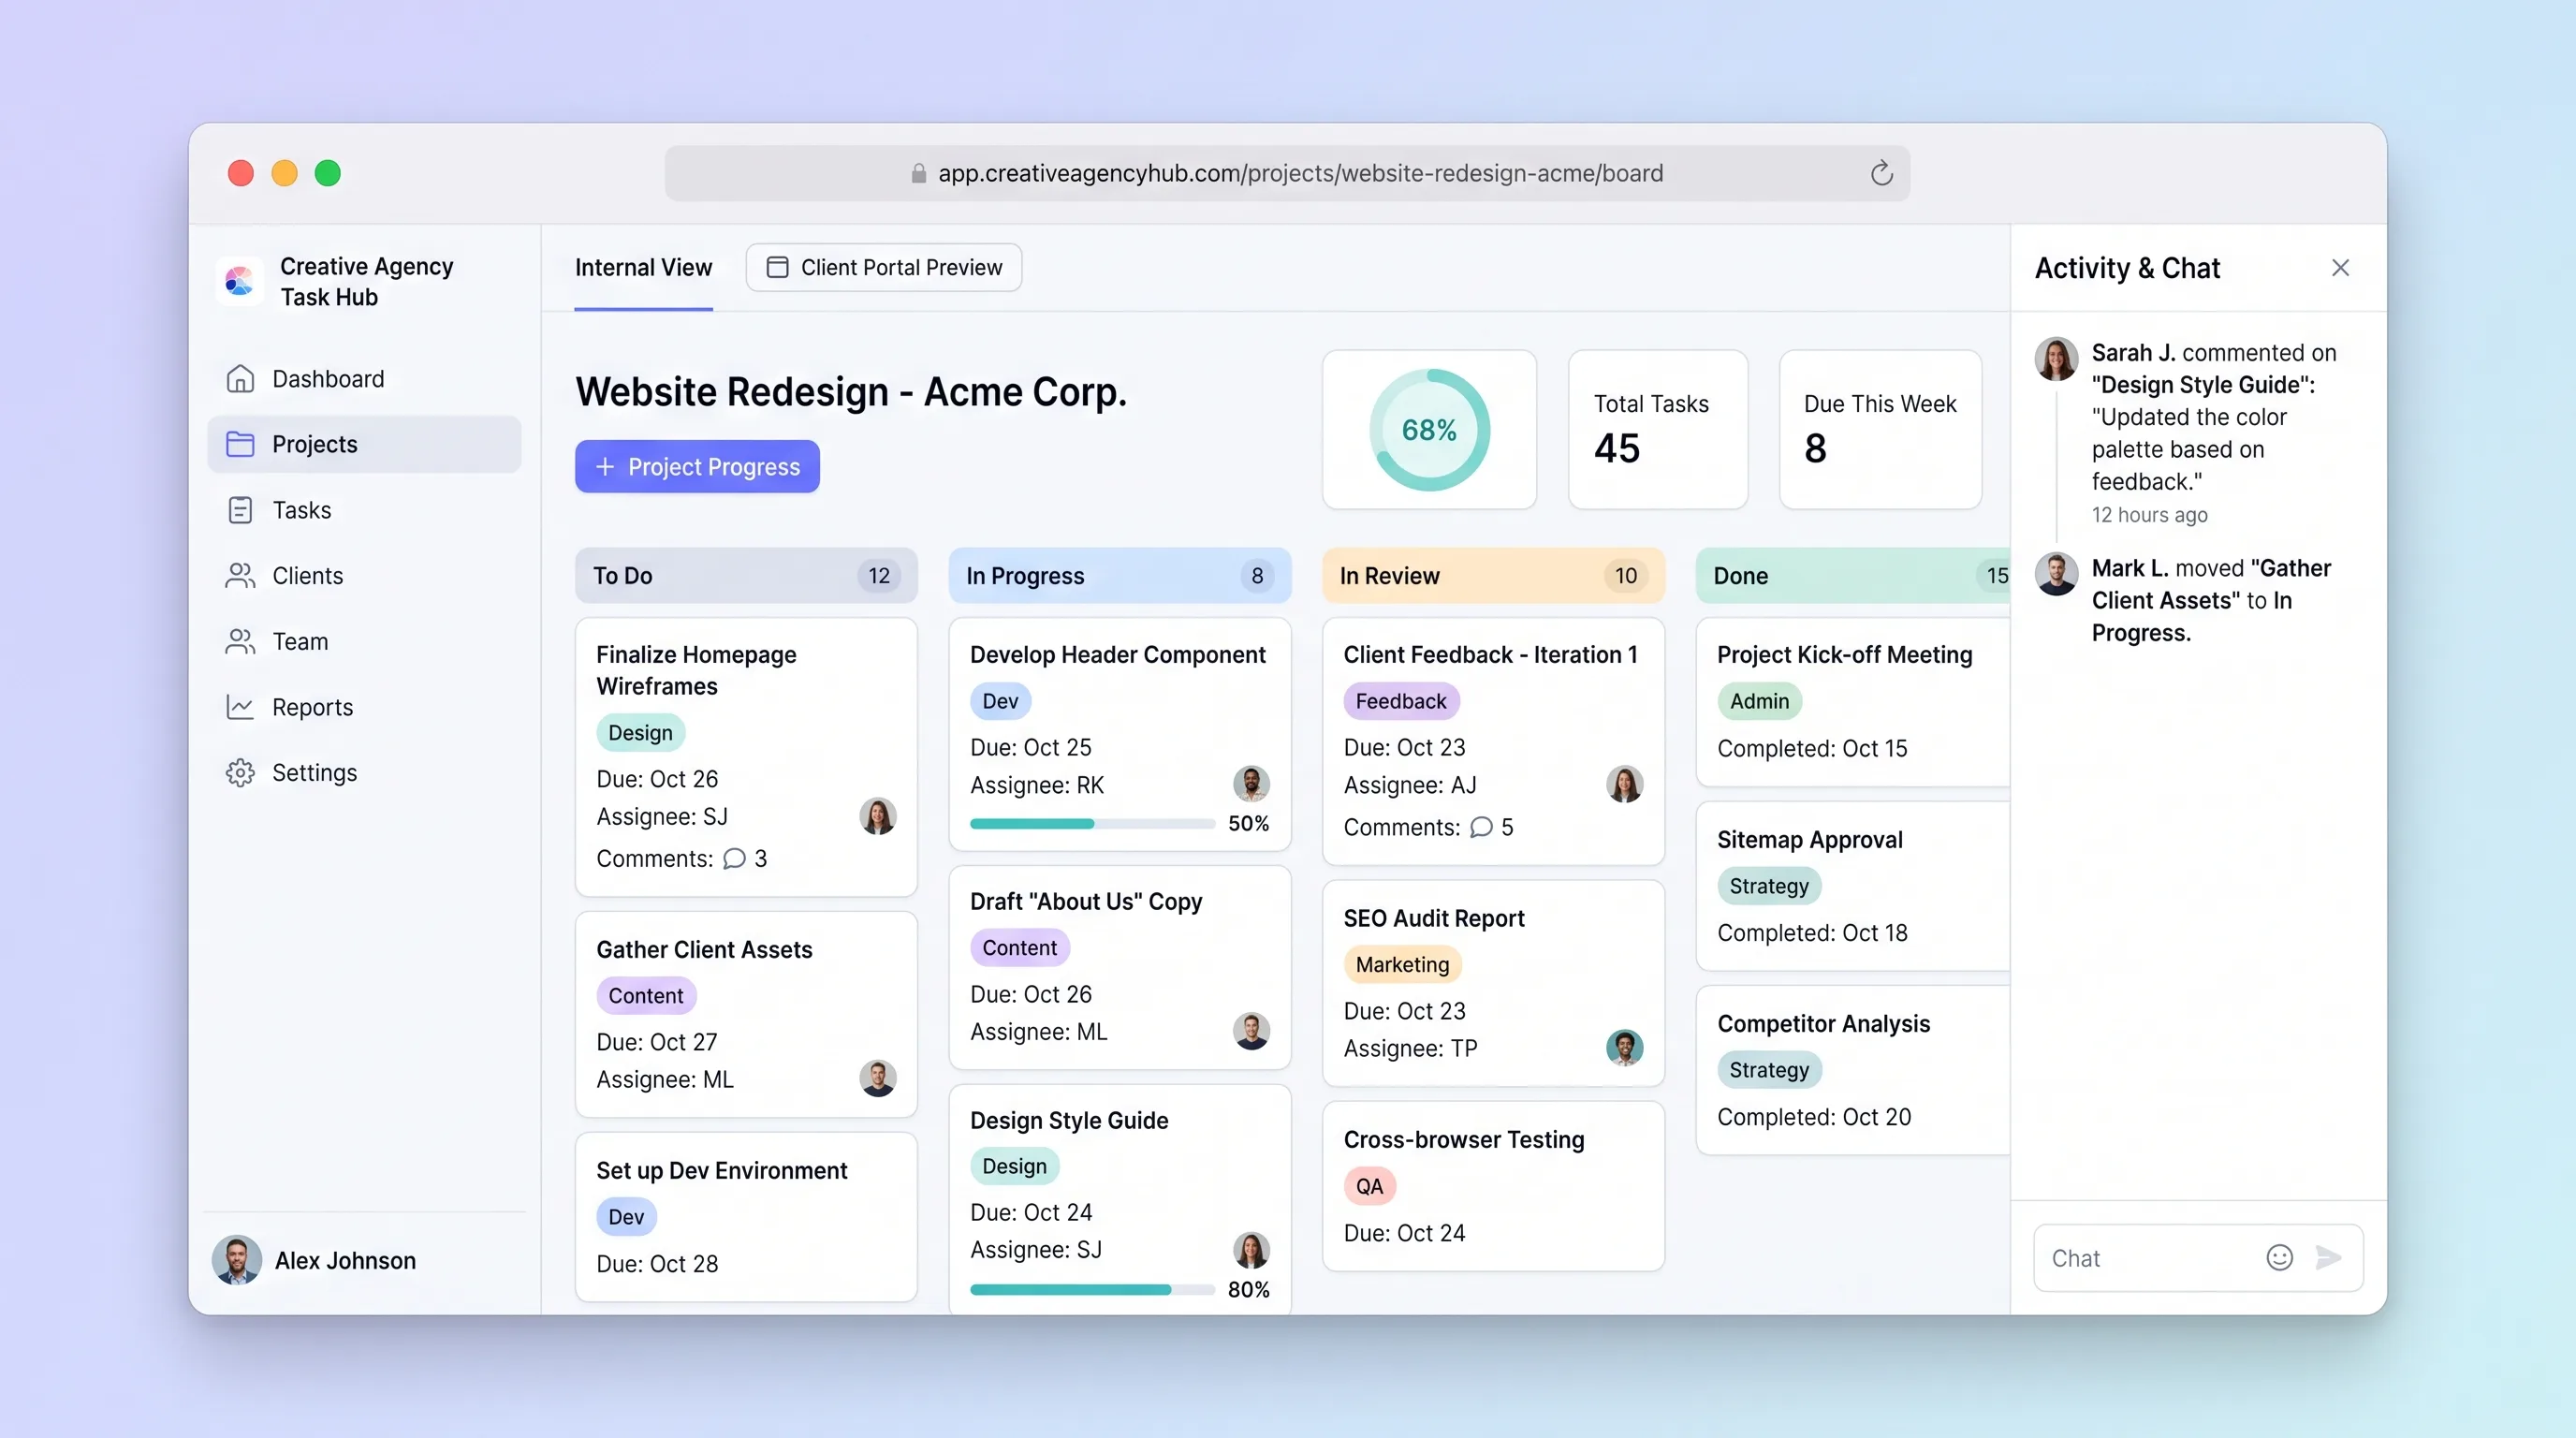
A focused project tracker where small creative agencies manage deliverables on an internal kanban board and share branded client portals for progress review and approvals without email chains.
SaaS WorkflowDeveloper & IT Operations
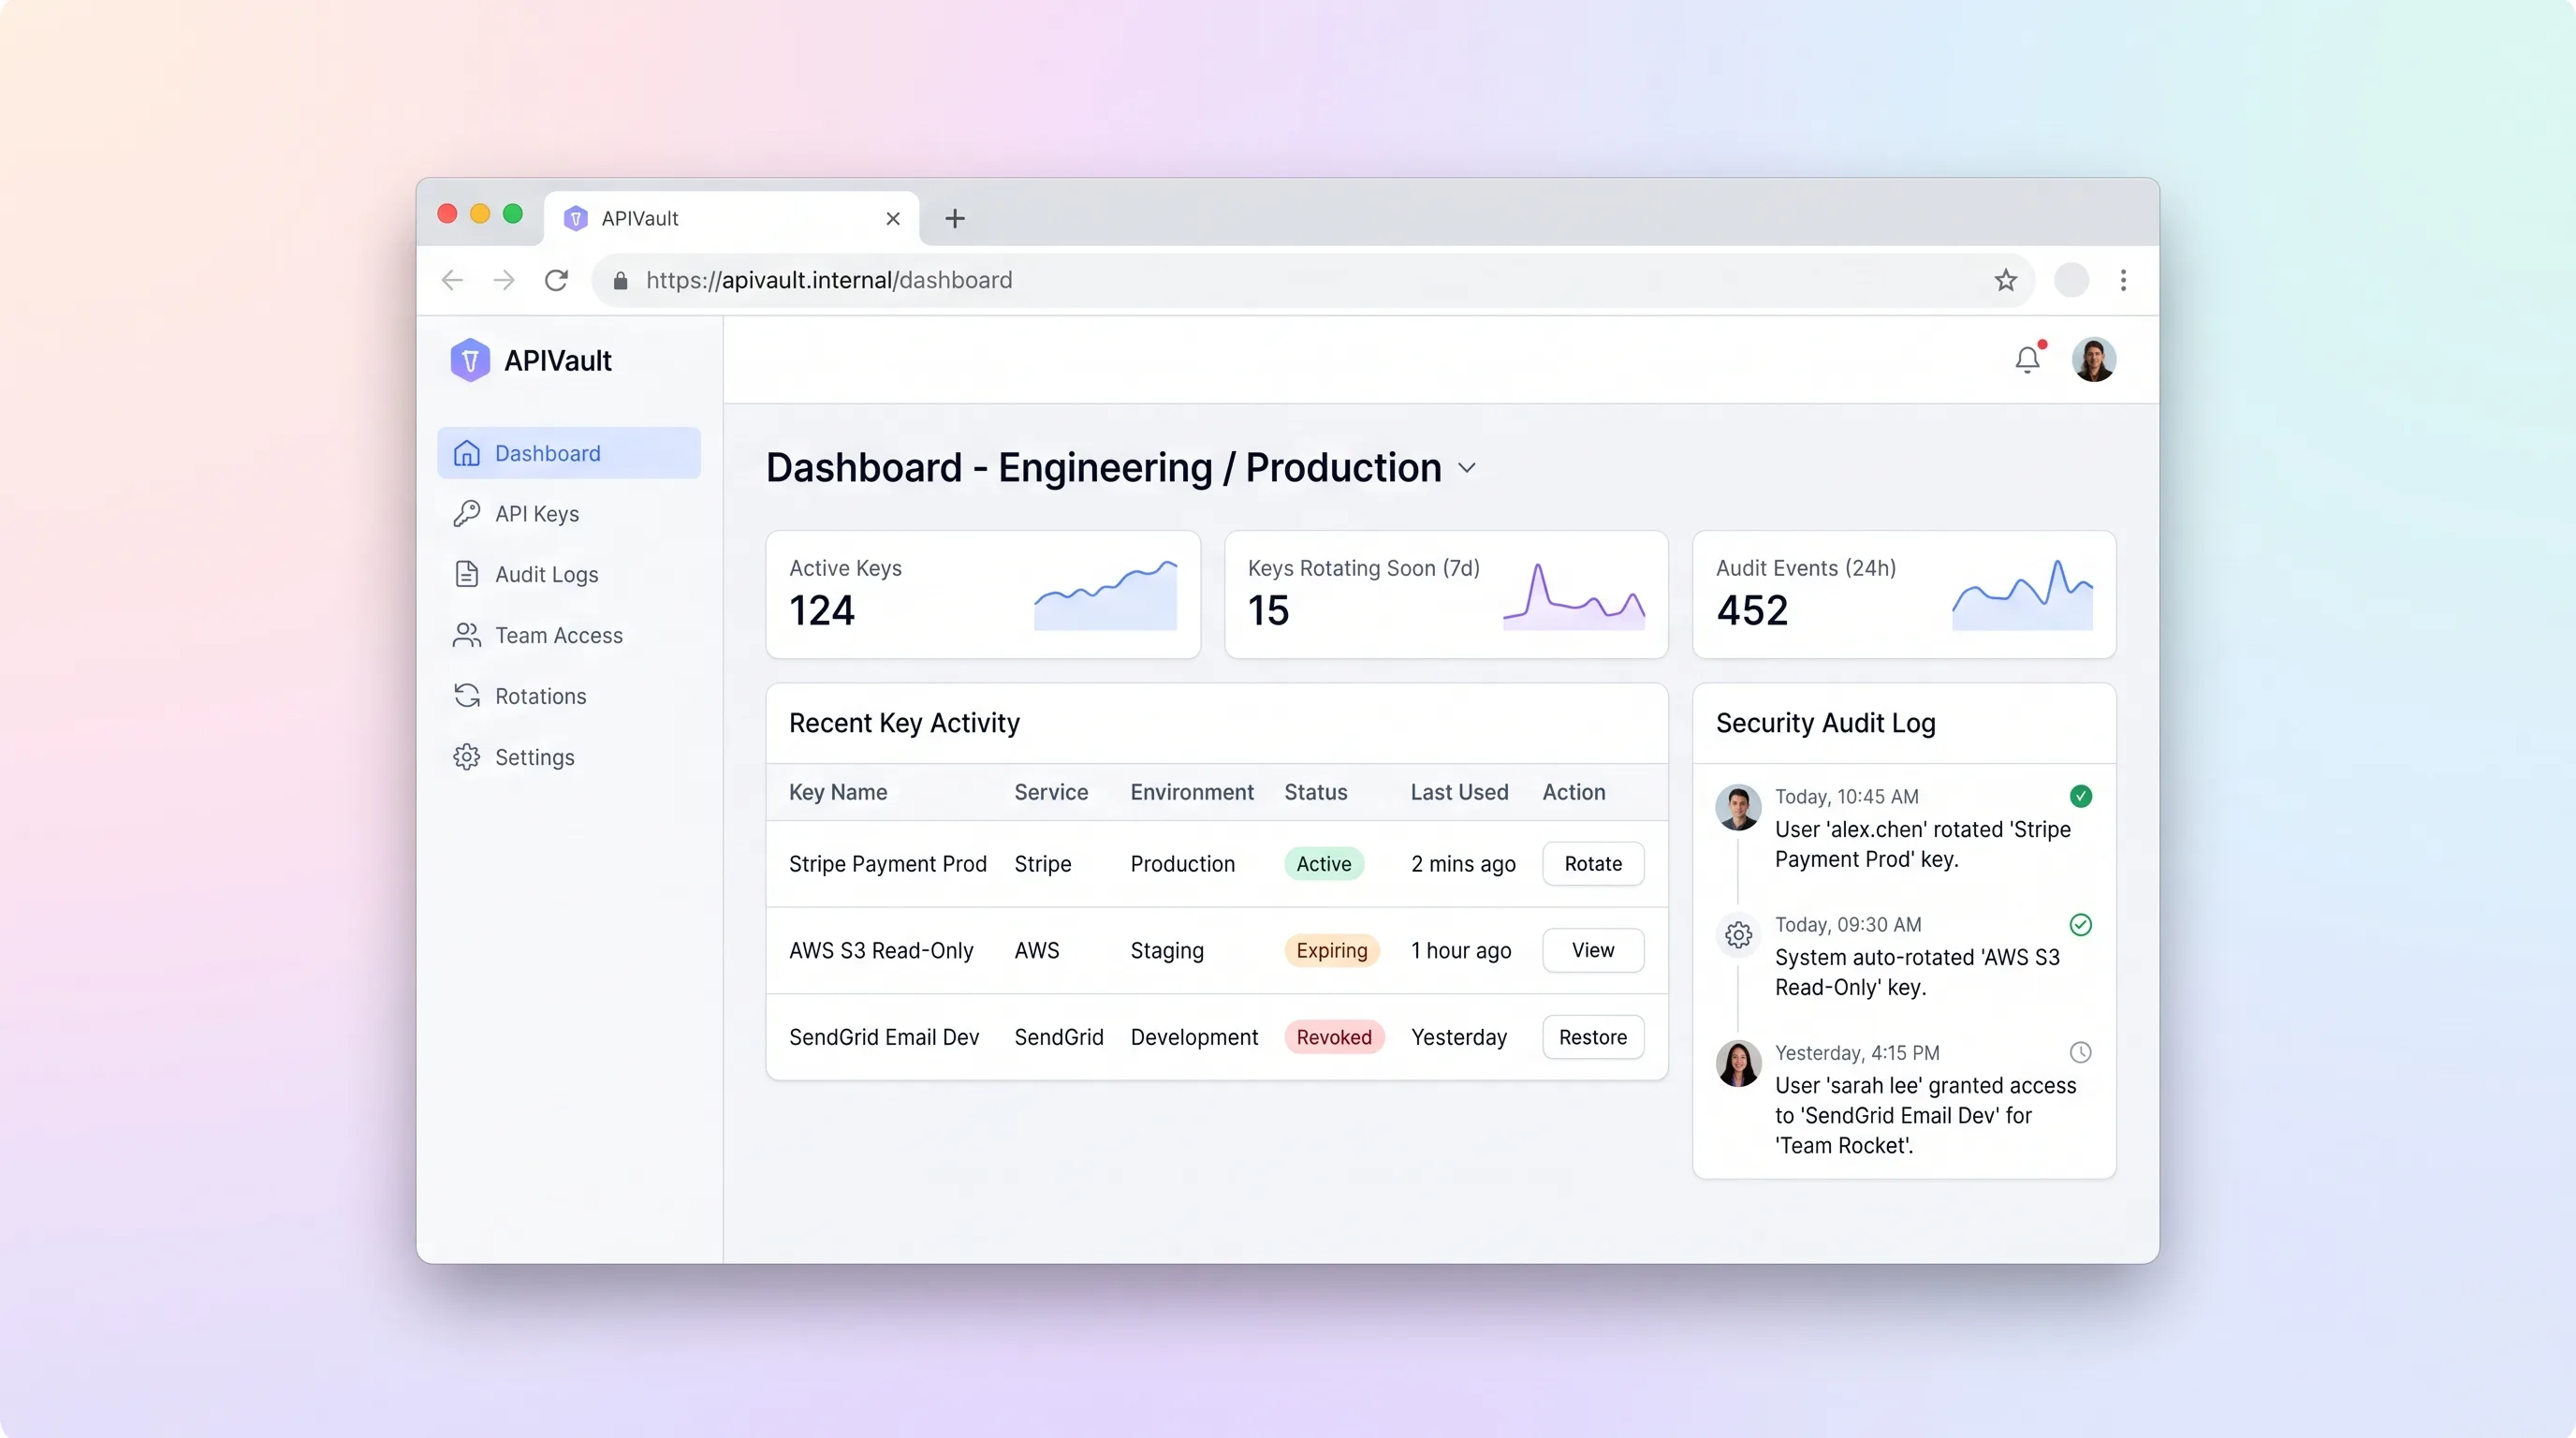
A focused internal tool for indie dev teams to store, rotate, and audit API keys across projects and environments with workspace-level access controls and a full activity trail.