Build this if
Solo consultants can track work but cannot connect pipeline timing to delivery capacity and client risk.
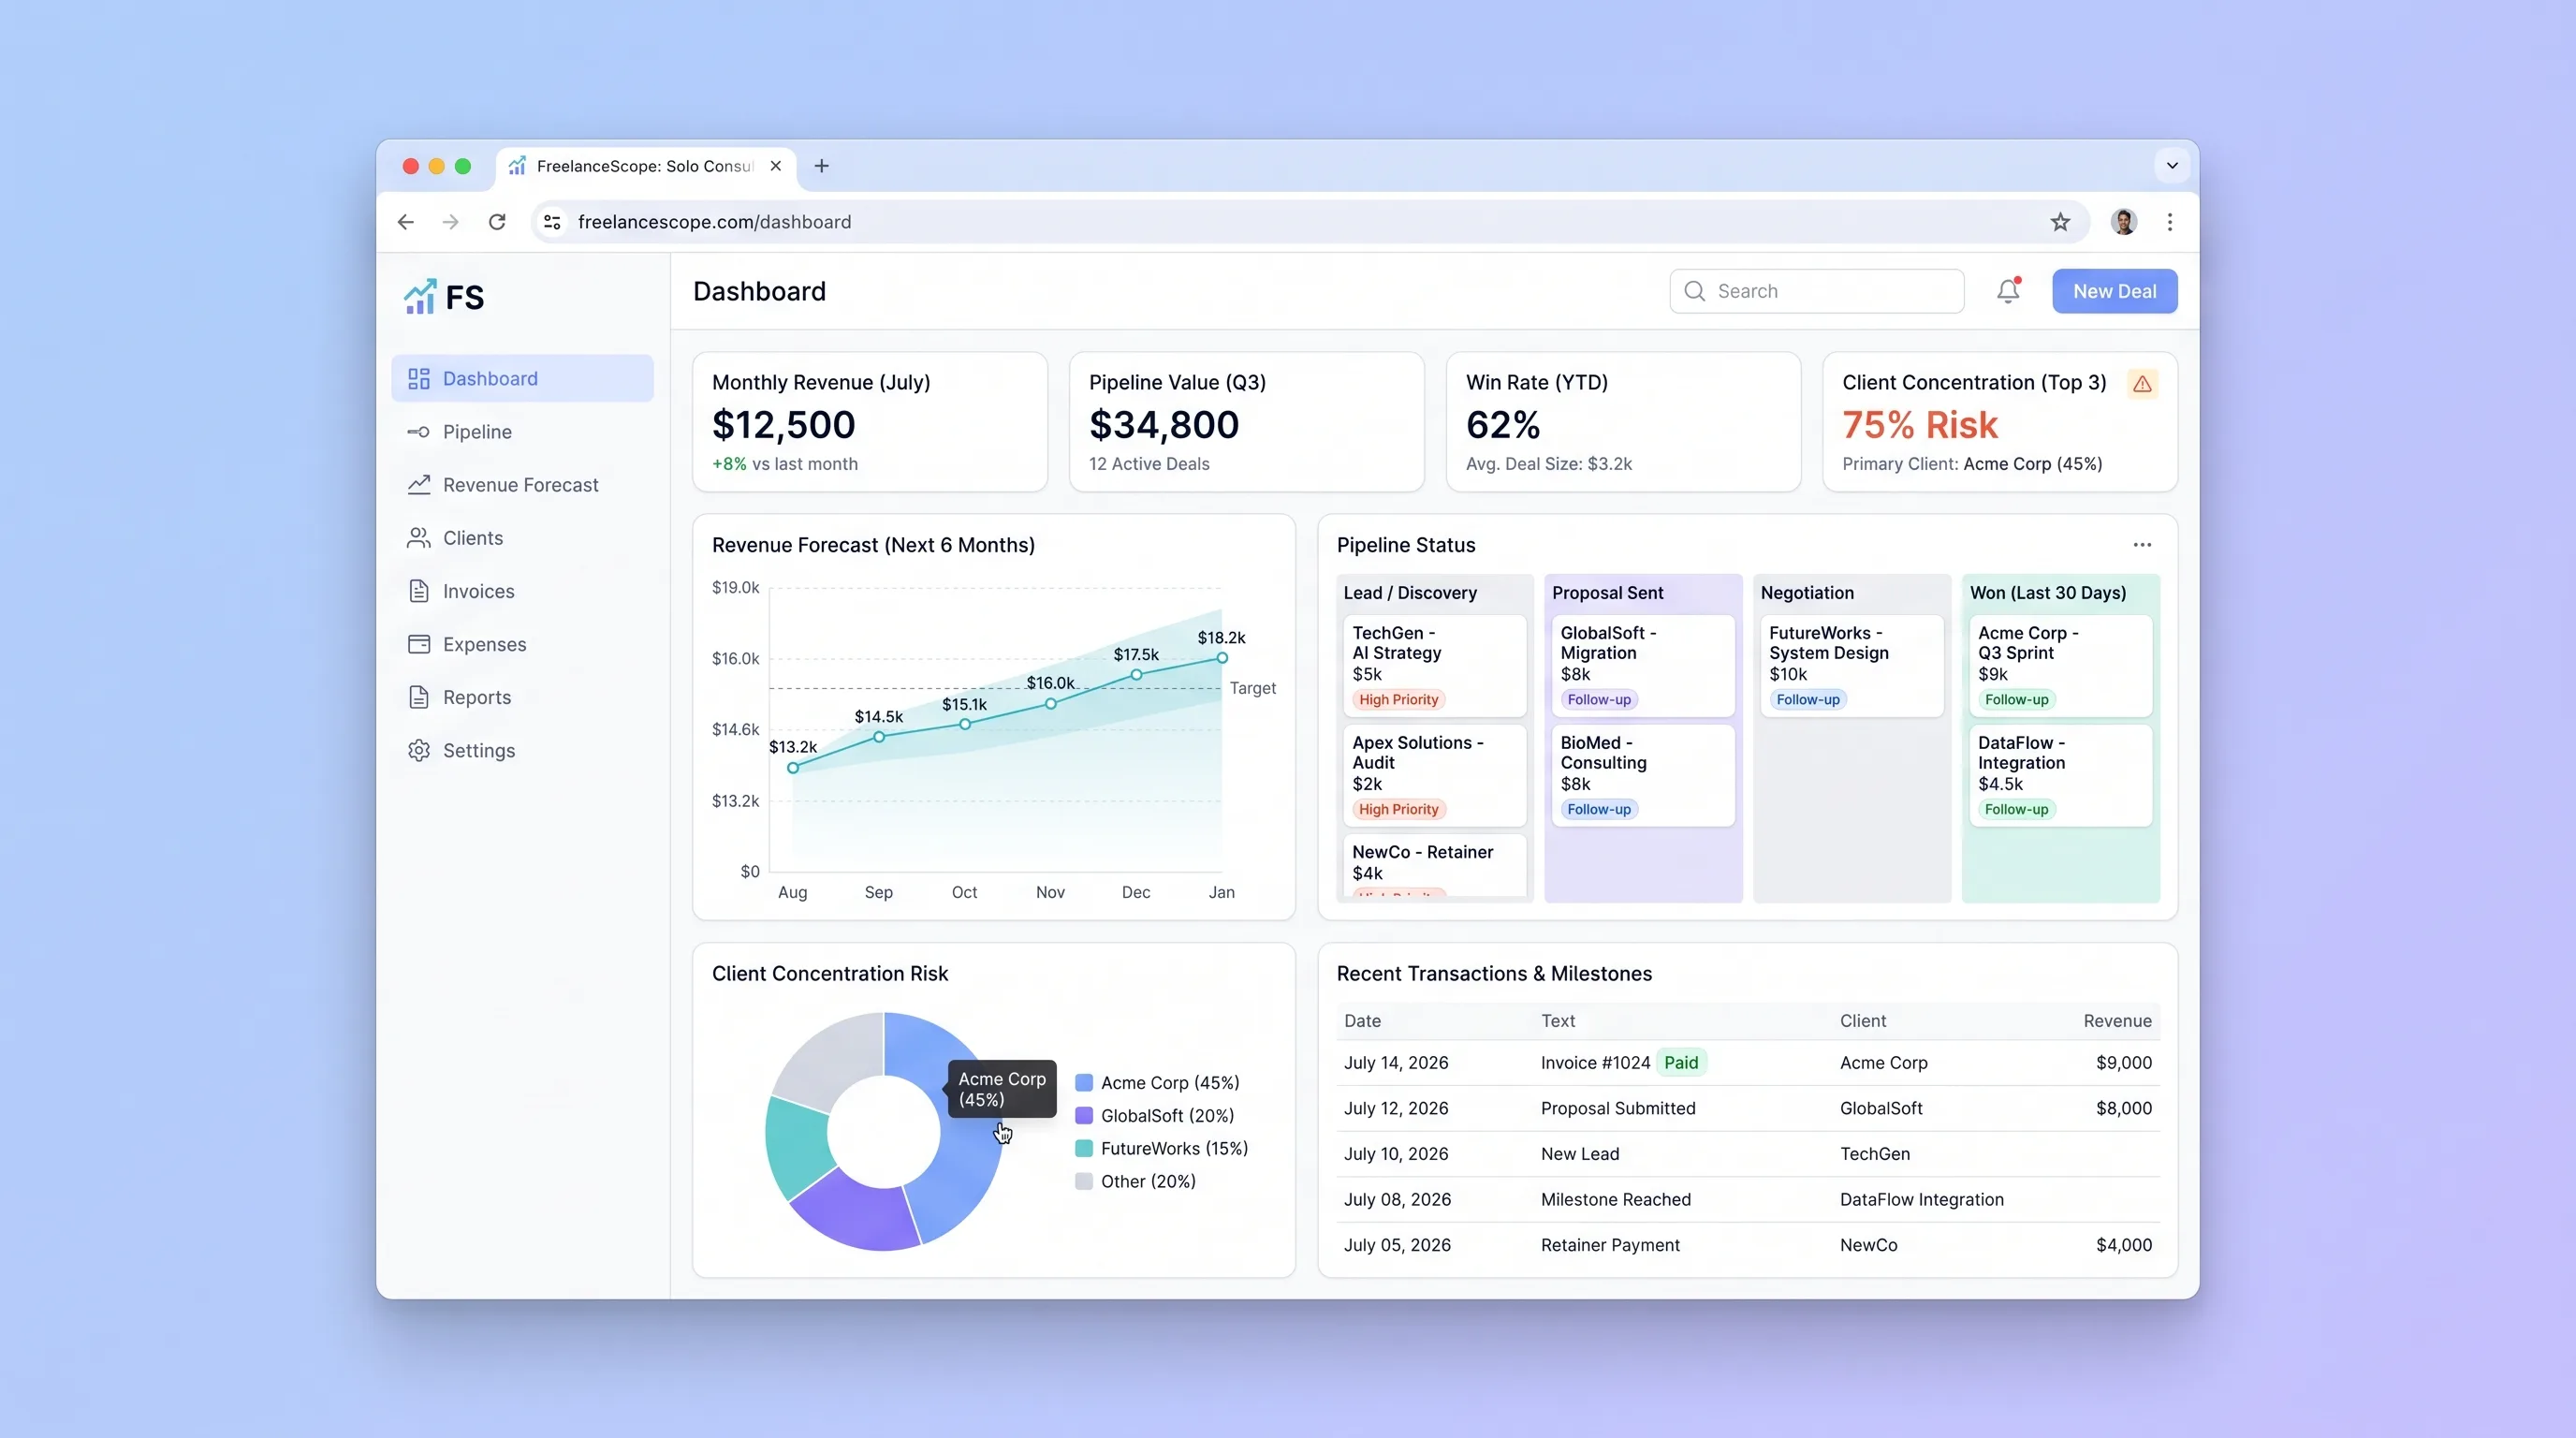
A lightweight planning tool that turns a solo consultant's opportunities and active projects into a weekly revenue forecast, capacity view, and client concentration warning.
Decision snapshot
Solo consultants can track work but cannot connect pipeline timing to delivery capacity and client risk.
The real need is team CRM, accounting, time tracking, or automated bank reconciliation.
Have 10 consultants enter their live 90-day book and compare the tool's forecast, capacity, and top-client share with their own manual calculation.
Problem and target customer
Independent consultants often keep sales leads, signed projects, delivery dates, and cash expectations in different sheets or notes. They cannot see whether a promising month is double-booked or whether too much future revenue depends on one client.
Independent consultants and fractional specialists who sell project-based work and personally manage both sales and delivery capacity.
Low-cost monthly subscription with an annual solo plan.
Editorial note
The dashboard should help one person make a Monday decision, not imitate an enterprise CRM. Forecast timing, booked delivery days, and client concentration belong together because each can make an apparently healthy pipeline misleading.
Every number should remain inspectable. Stage probability is an editable assumption, capacity comes from project allocations, and concentration states its date range and denominator. That transparency matters more than predictive sophistication.
Choose your next step
Evaluate the operating tradeoffs quickly, or inspect how to build the MVP.
Compare the three operating paths at the default workload before opening the full calculator.
See cost preview Build this ideaInspect the build blueprintReview MVP scope, workflow, states, data rules, architecture, and acceptance criteria.
Open blueprintEvaluation preview
Directional infrastructure estimates for the current 500 pipeline updates assumption. Open the full calculator when you are ready to change it.
Railway hosts the application and PostgreSQL database.
Lowest operating effortA Hetzner cloud server runs the app and database.
Lowest baseline costDedicated or larger resources isolate reporting and transactional load.
Most separation and controlBuild blueprint
Product goal
MVP scope
UX and user flow
Show weighted revenue, committed work, capacity gaps, and concentration alerts for 90 days.
Move opportunities through explicit stages and edit probability, value, and expected dates.
Place project days on weeks and expose overbooking or unused capacity.
Core entity outline
Groups opportunity, project, and revenue exposure for one customer.
Stores sales stage, amount, probability, close date, and proposed delivery window.
Represents won work, booked delivery days, and expected billing schedule.
Records planned consulting days for a project in one week.
Architecture and data flow
Serve pipeline, outlook, capacity, and settings views.
Calculate weighted revenue, weekly load, and concentration from persisted records.
Persist clients, opportunities, projects, allocations, and stage history.
Deliverables and acceptance
Recommended stack
A single private app is enough for forms and planning charts.
Relational links preserve forecast and project conversion integrity.
Simple time-series and concentration views need no analytics platform.
The solo account needs secure sessions and export protection.
Transparent arithmetic is the product. A small relational monolith makes every dashboard number traceable to an opportunity, project, or allocation and avoids unnecessary AI or analytics infrastructure.
Copy the build prompt, model the operating cost, and choose where to deploy.
Execution
Once the blueprint is clear, use the prompt, cost model, and deployment options to start building.
Build prompt
Use a TypeScript monolith with PostgreSQL; calculate forecasts and concentration deterministically from user-entered amounts, dates, probabilities, and capacity rather than using AI.
Build prompt
Open the prompt pack whenever you are ready to take this blueprint into your builder.
Build prompt ready
Copy the prompt into your builder, then use the cost model below to choose how you want to run it.
Use the cost model to choose a deployment path that matches the build plan.
Cost calculator
A technical run-cost estimate for the first production version. Team, acquisition, payment fees, and business COGS are excluded.
$5-$35 per 500 pipeline updates
Low and high values allow for usage variance and plan headroom.
Railway hosts the application and PostgreSQL database.
2K pipeline updates included, then $2-$8 per 2K pipeline updatesThe estimate combines the selected infrastructure path, required operating modules, selected optional modules, and usage above included monthly allowances. Taxes and regional uplifts are excluded.
Deployment options
Choose based on operating preference, not only the headline price.
Deploy the private app and database with minimal setup.
Resource pricing exceeds a tiny VPS at stable low usage.
Run the app, worker, and database on one small Vultr VPS with Docker Compose and explicit backups.
You own patching, backups, and monitoring.
Separate application, worker, data, storage, and backup responsibilities as the workload grows.
Overbuilt for the first solo-consultant pilot.
Start building
Use Lovable to test opportunity entry, weekly forecast, capacity timeline, and concentration alerts with solo consultants.
Open Lovable 02AutomationAdd optional intake captureUse Make later to turn a qualified website form into a draft opportunity; all amounts, stages, and probabilities remain consultant-controlled.
Open Make 03DeployDeploy the private planning toolHost the app and PostgreSQL database together for a simple, low-maintenance solo workspace.
Open RailwayKeep exploring
Internal ToolReal Estate
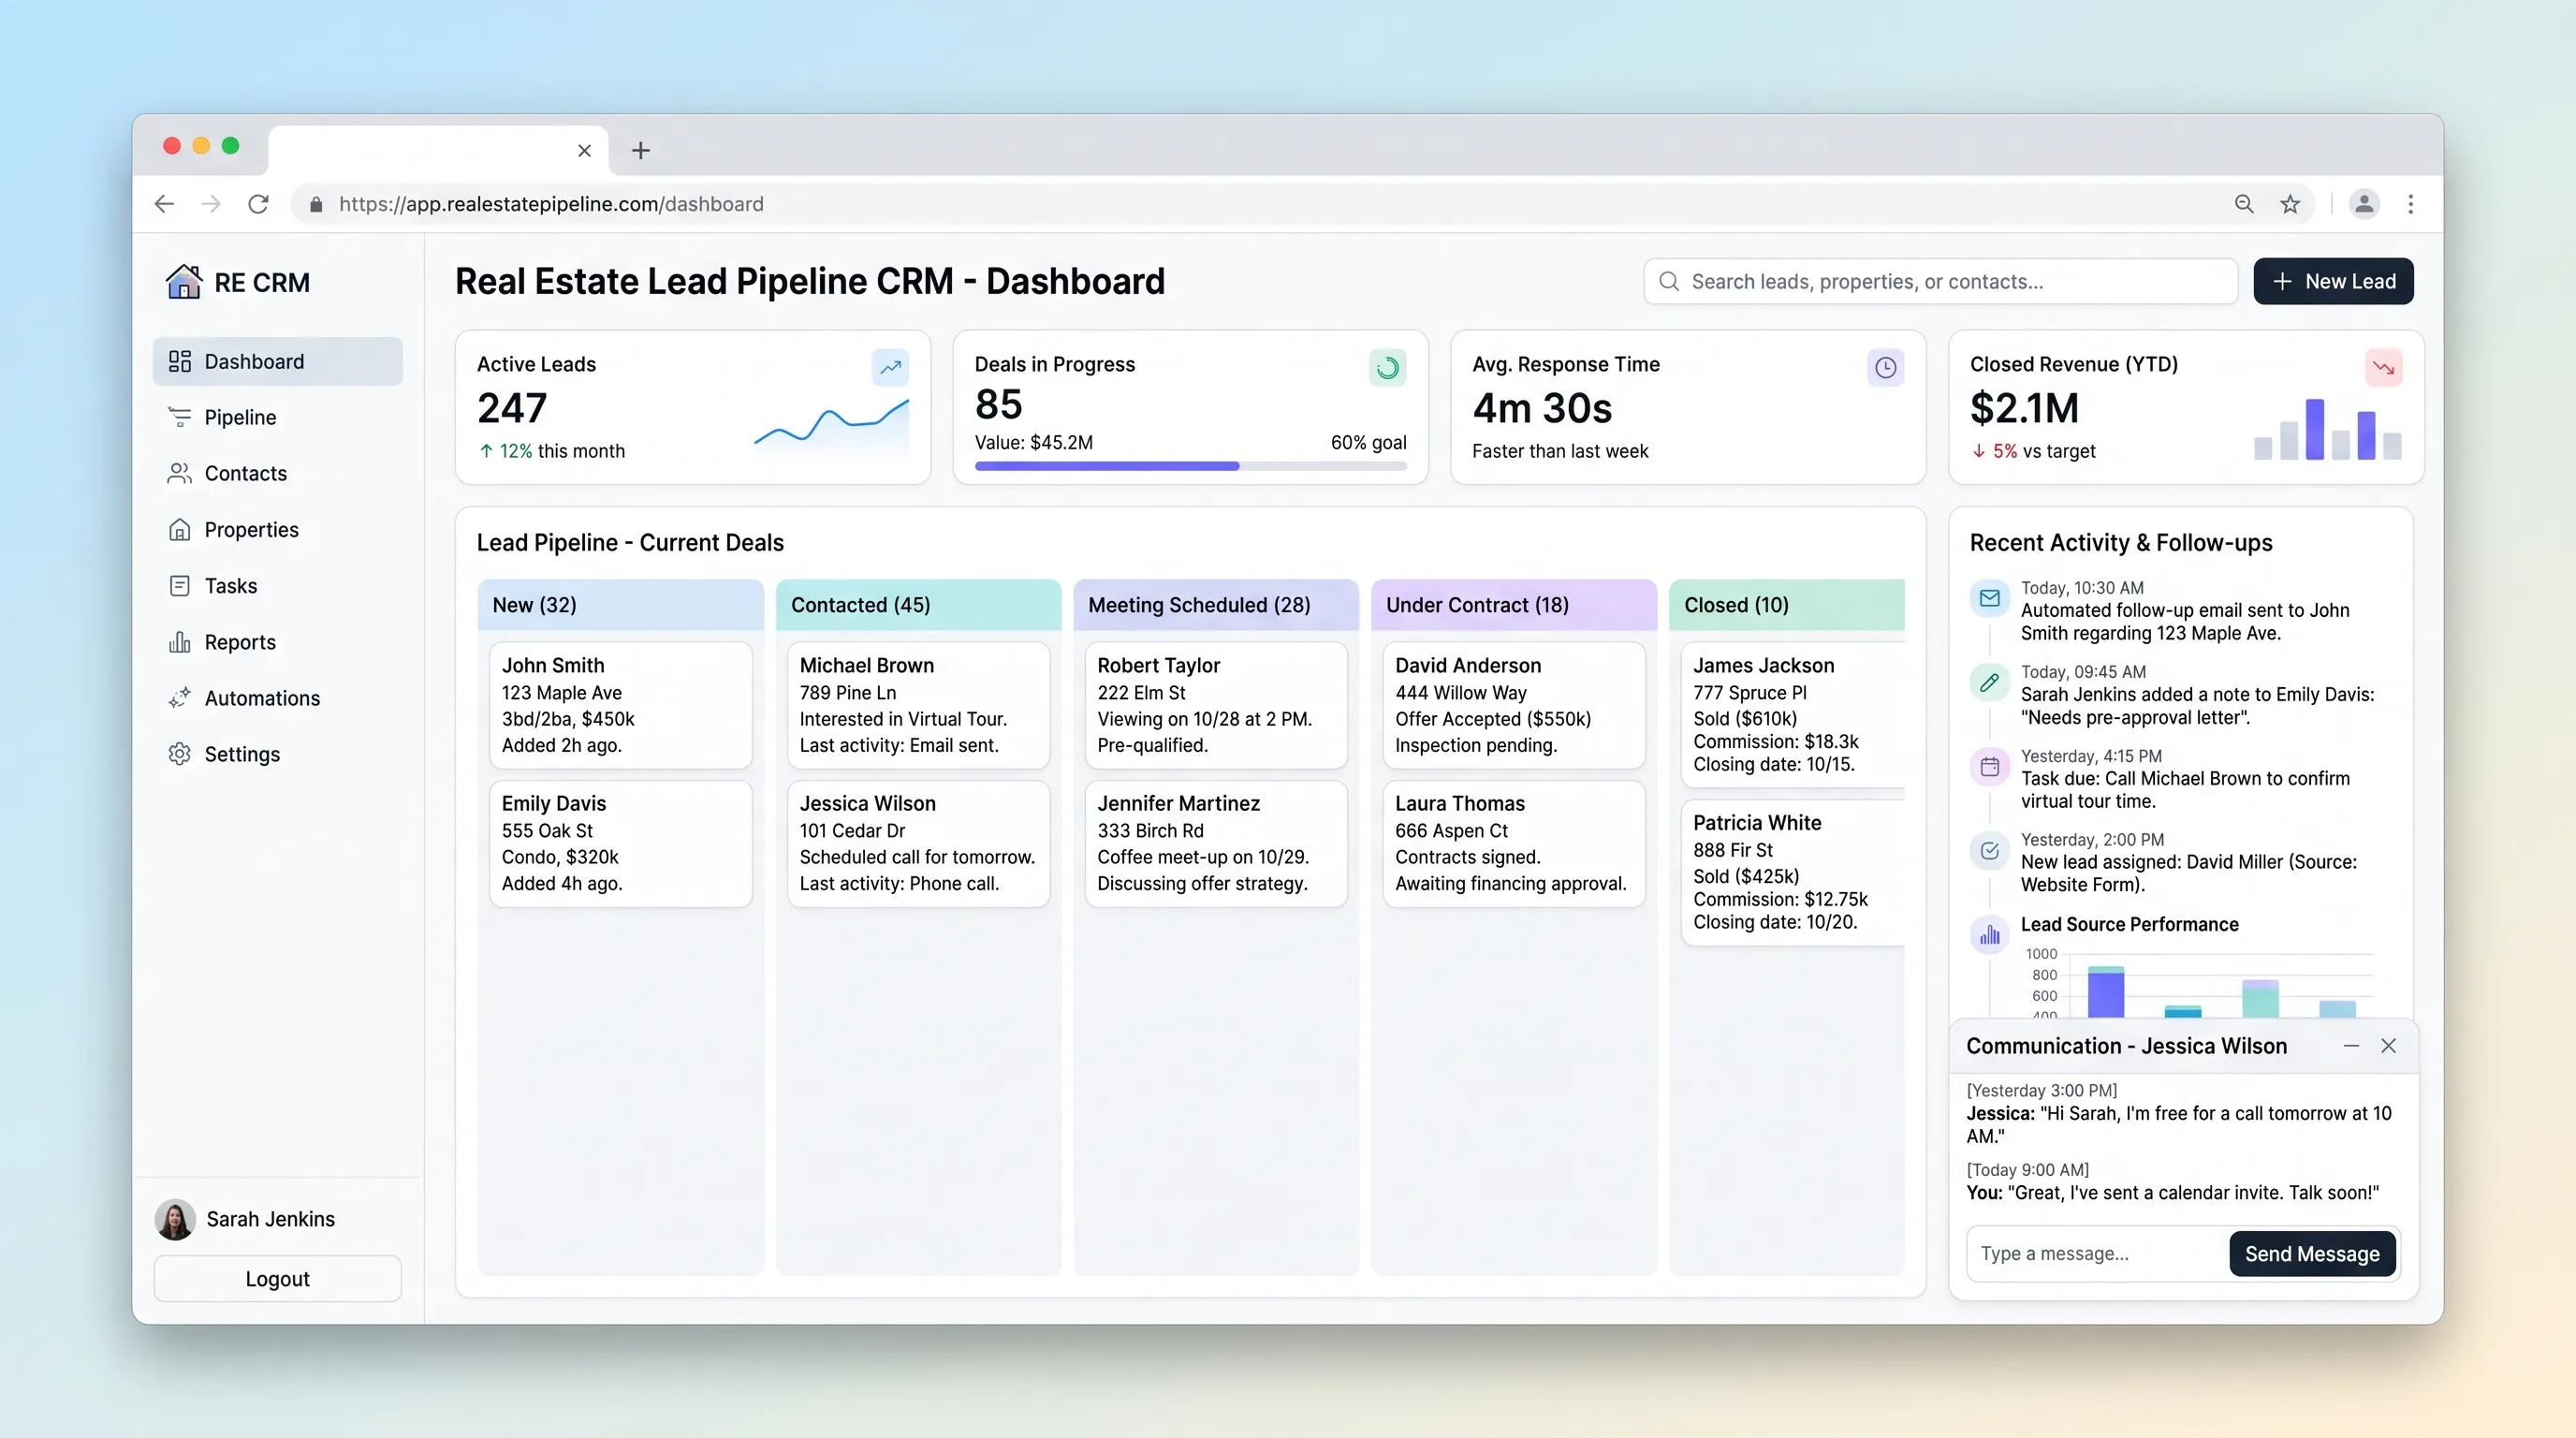
A focused CRM for agents to qualify property inquiries, schedule the next contact, move opportunities through deal stages, and see overdue follow-ups.
Internal ToolDeveloper & IT Operations
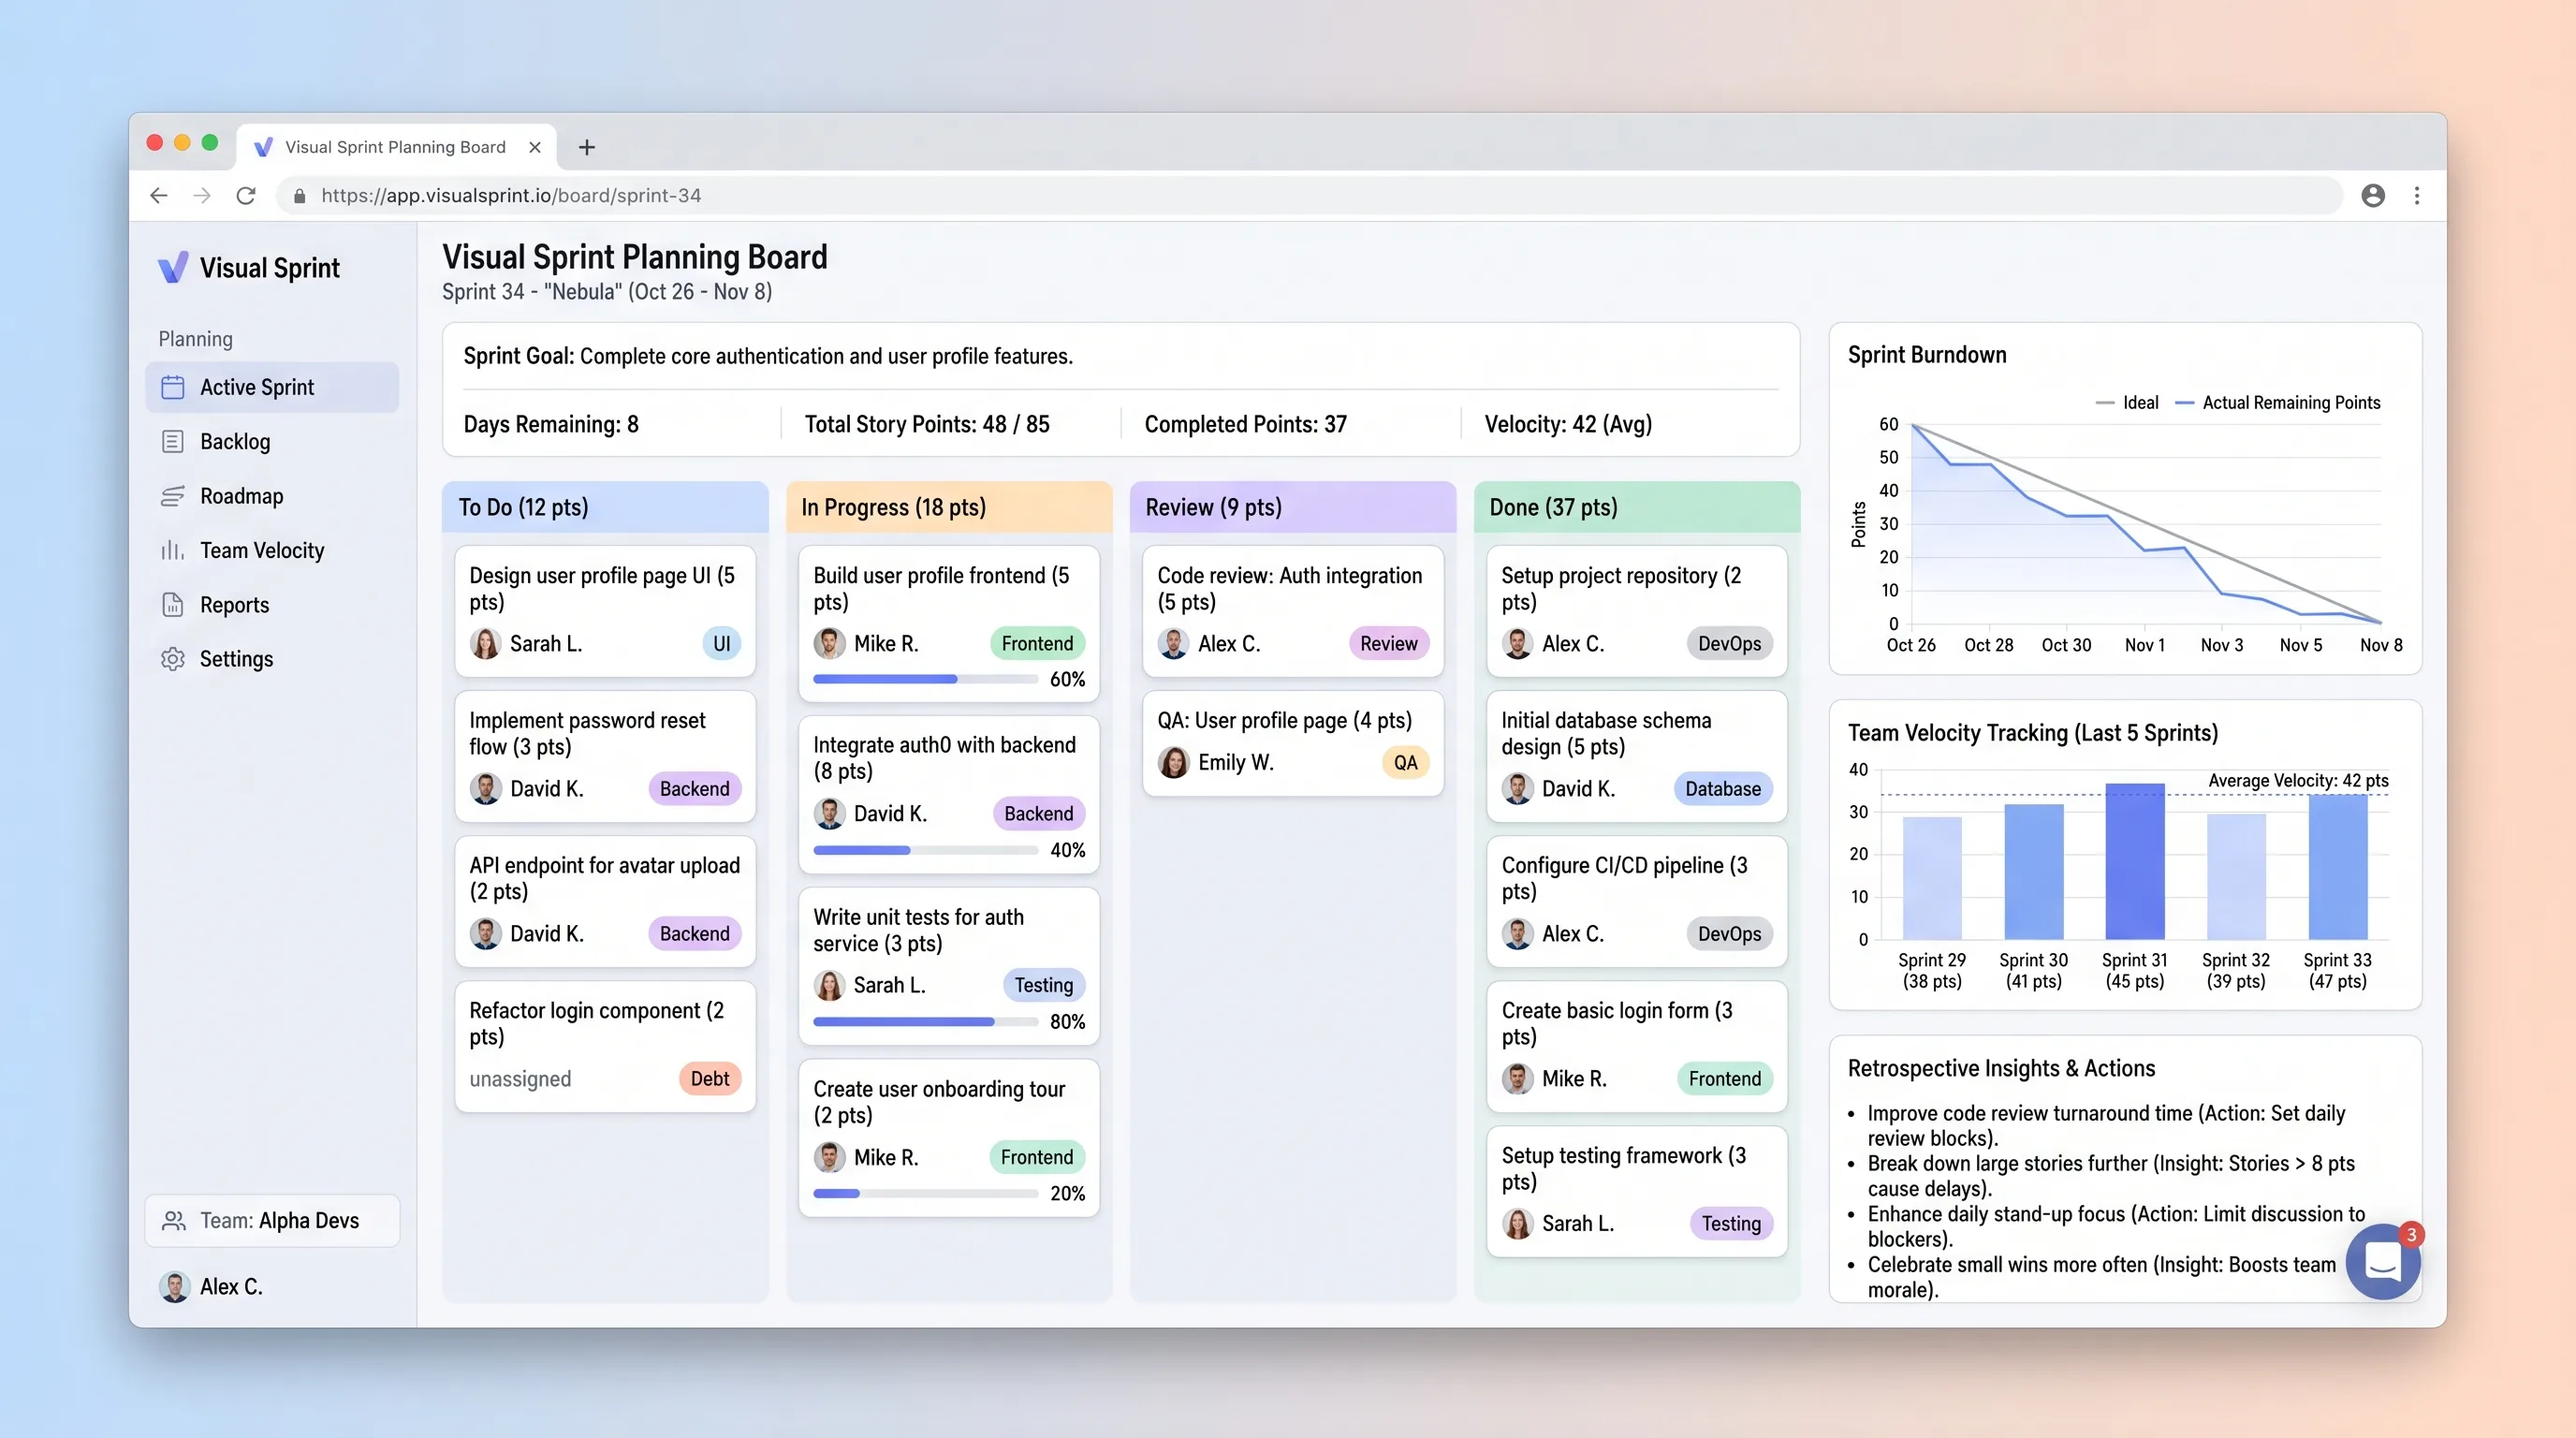
A sprint board that helps small development teams commit work against recent capacity, track story-point movement, and carry evidence into retrospectives.
Internal ToolHome & Local Services
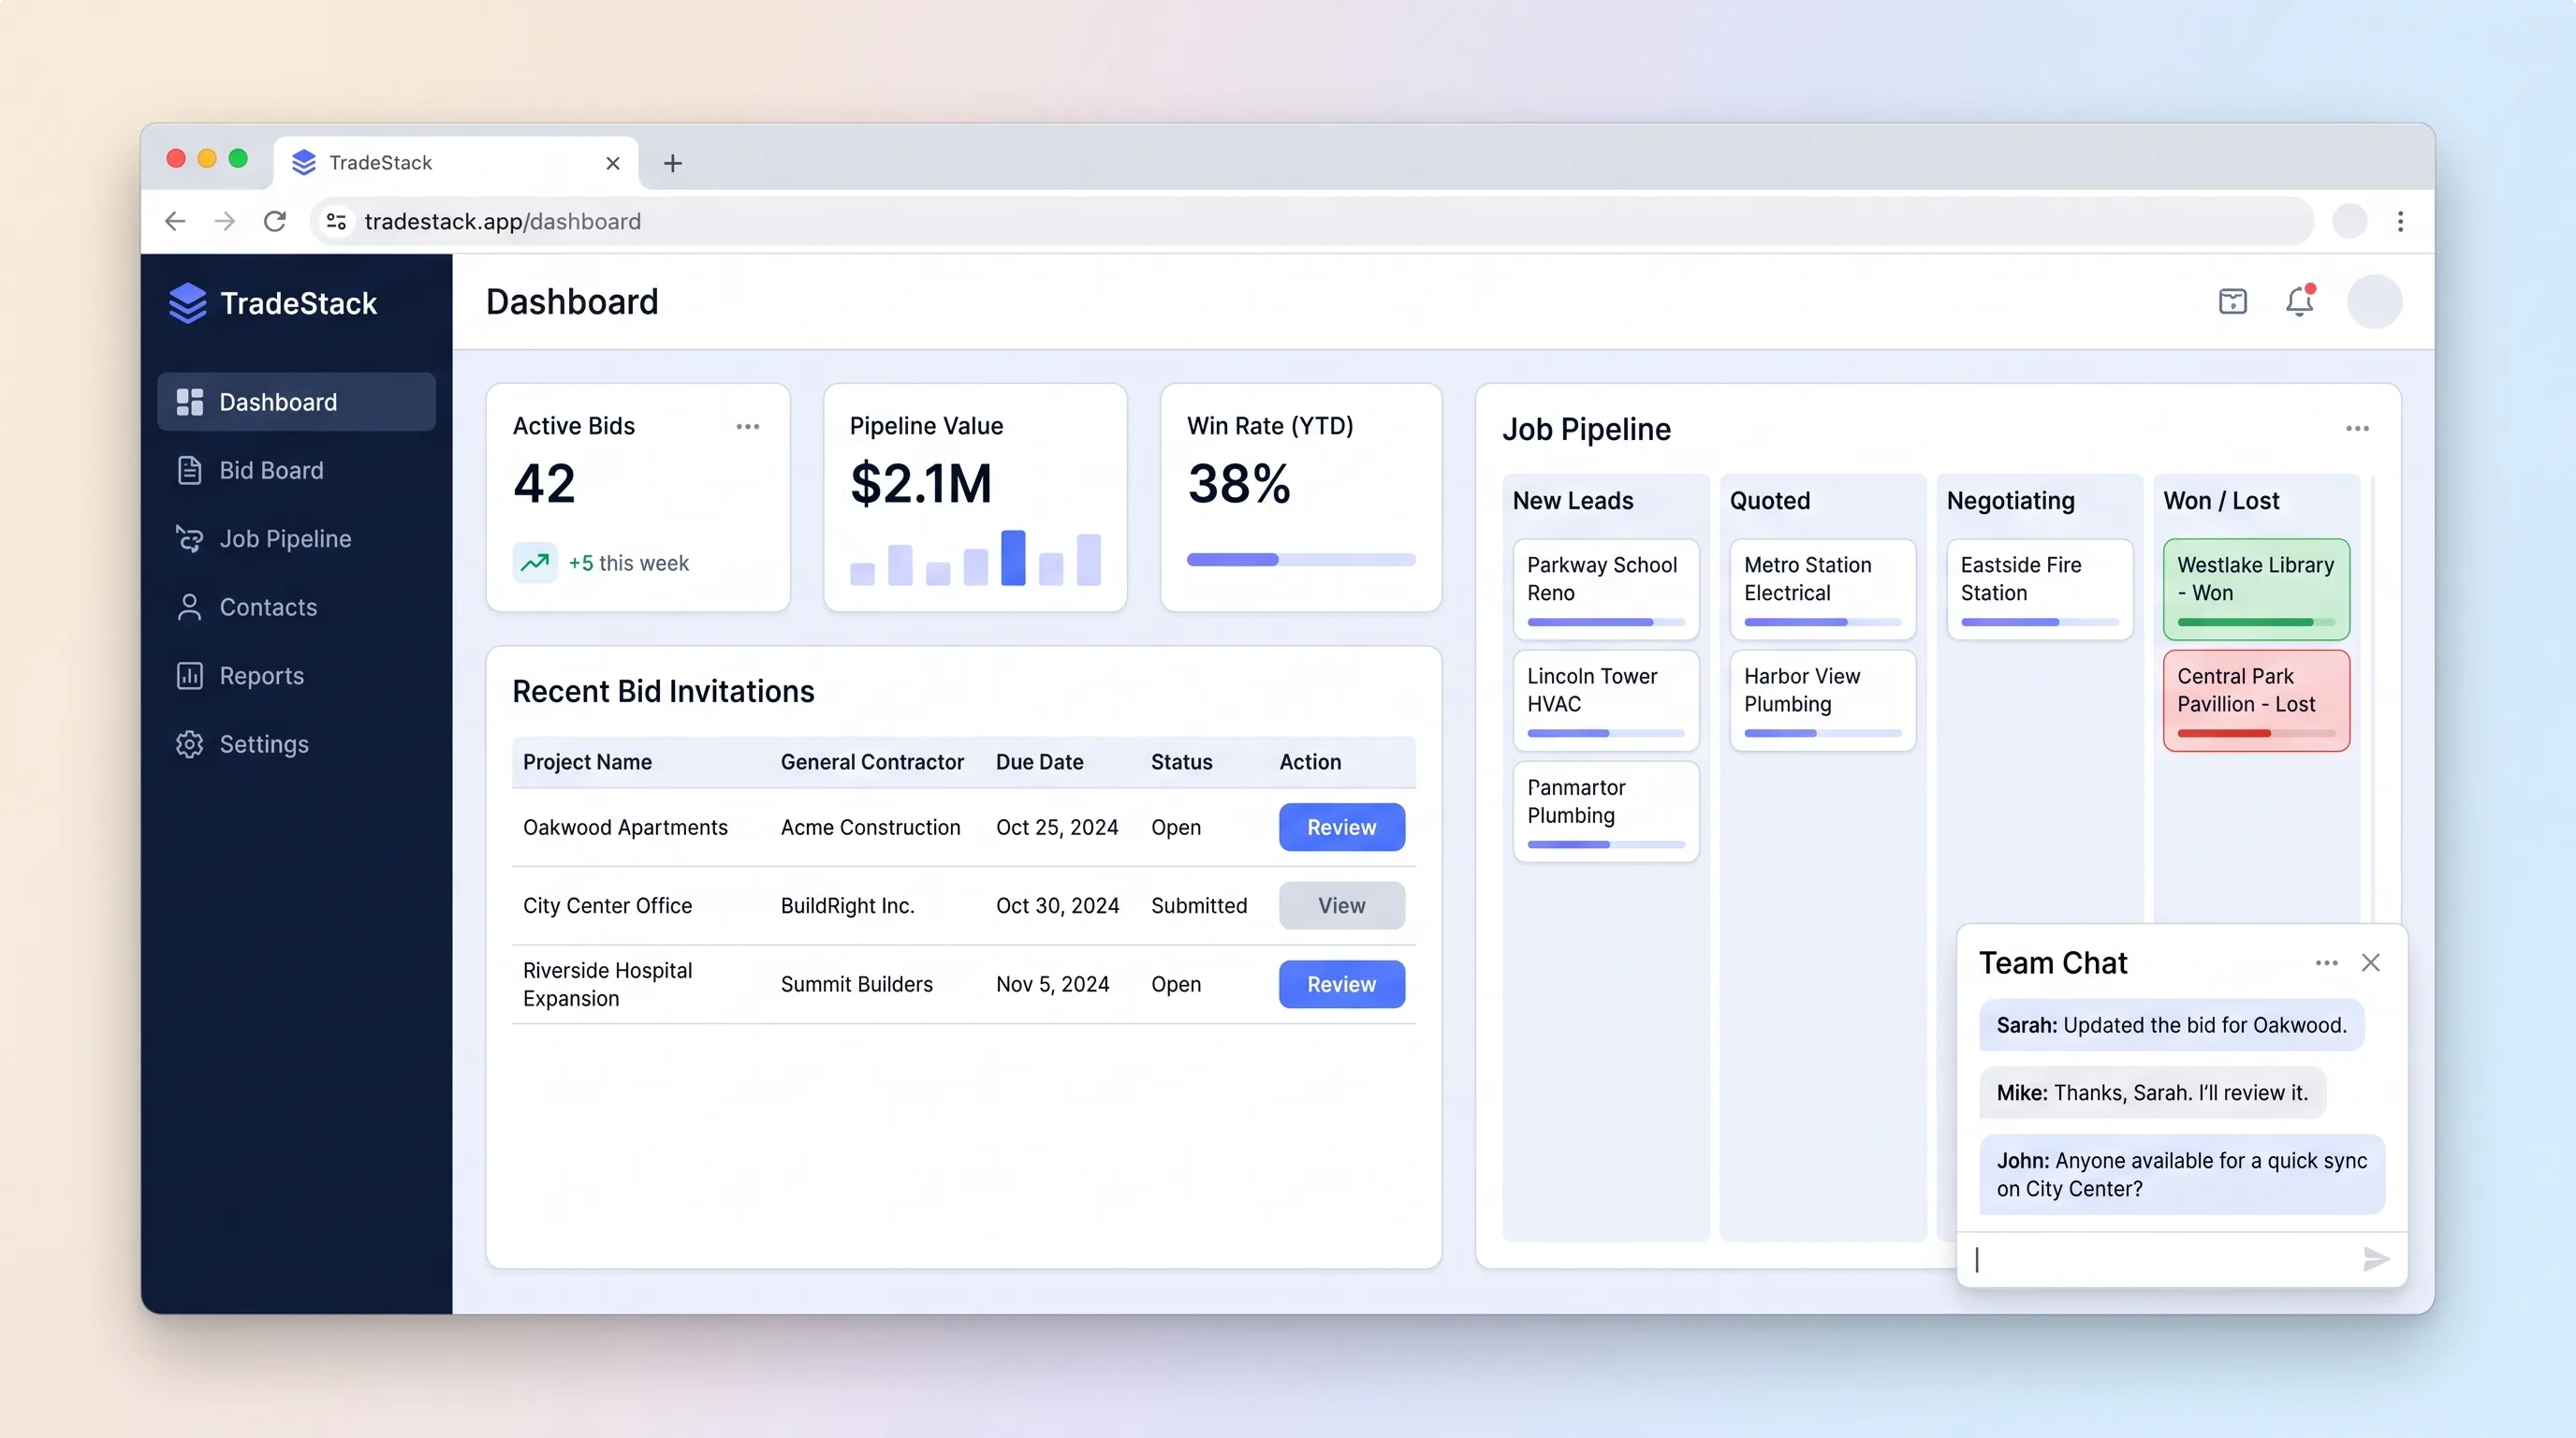
An internal bid desk for specialty contractors to capture invitations, prepare deadlines, move opportunities through estimating, and learn from won or lost work.
Internal ToolEvents & Community
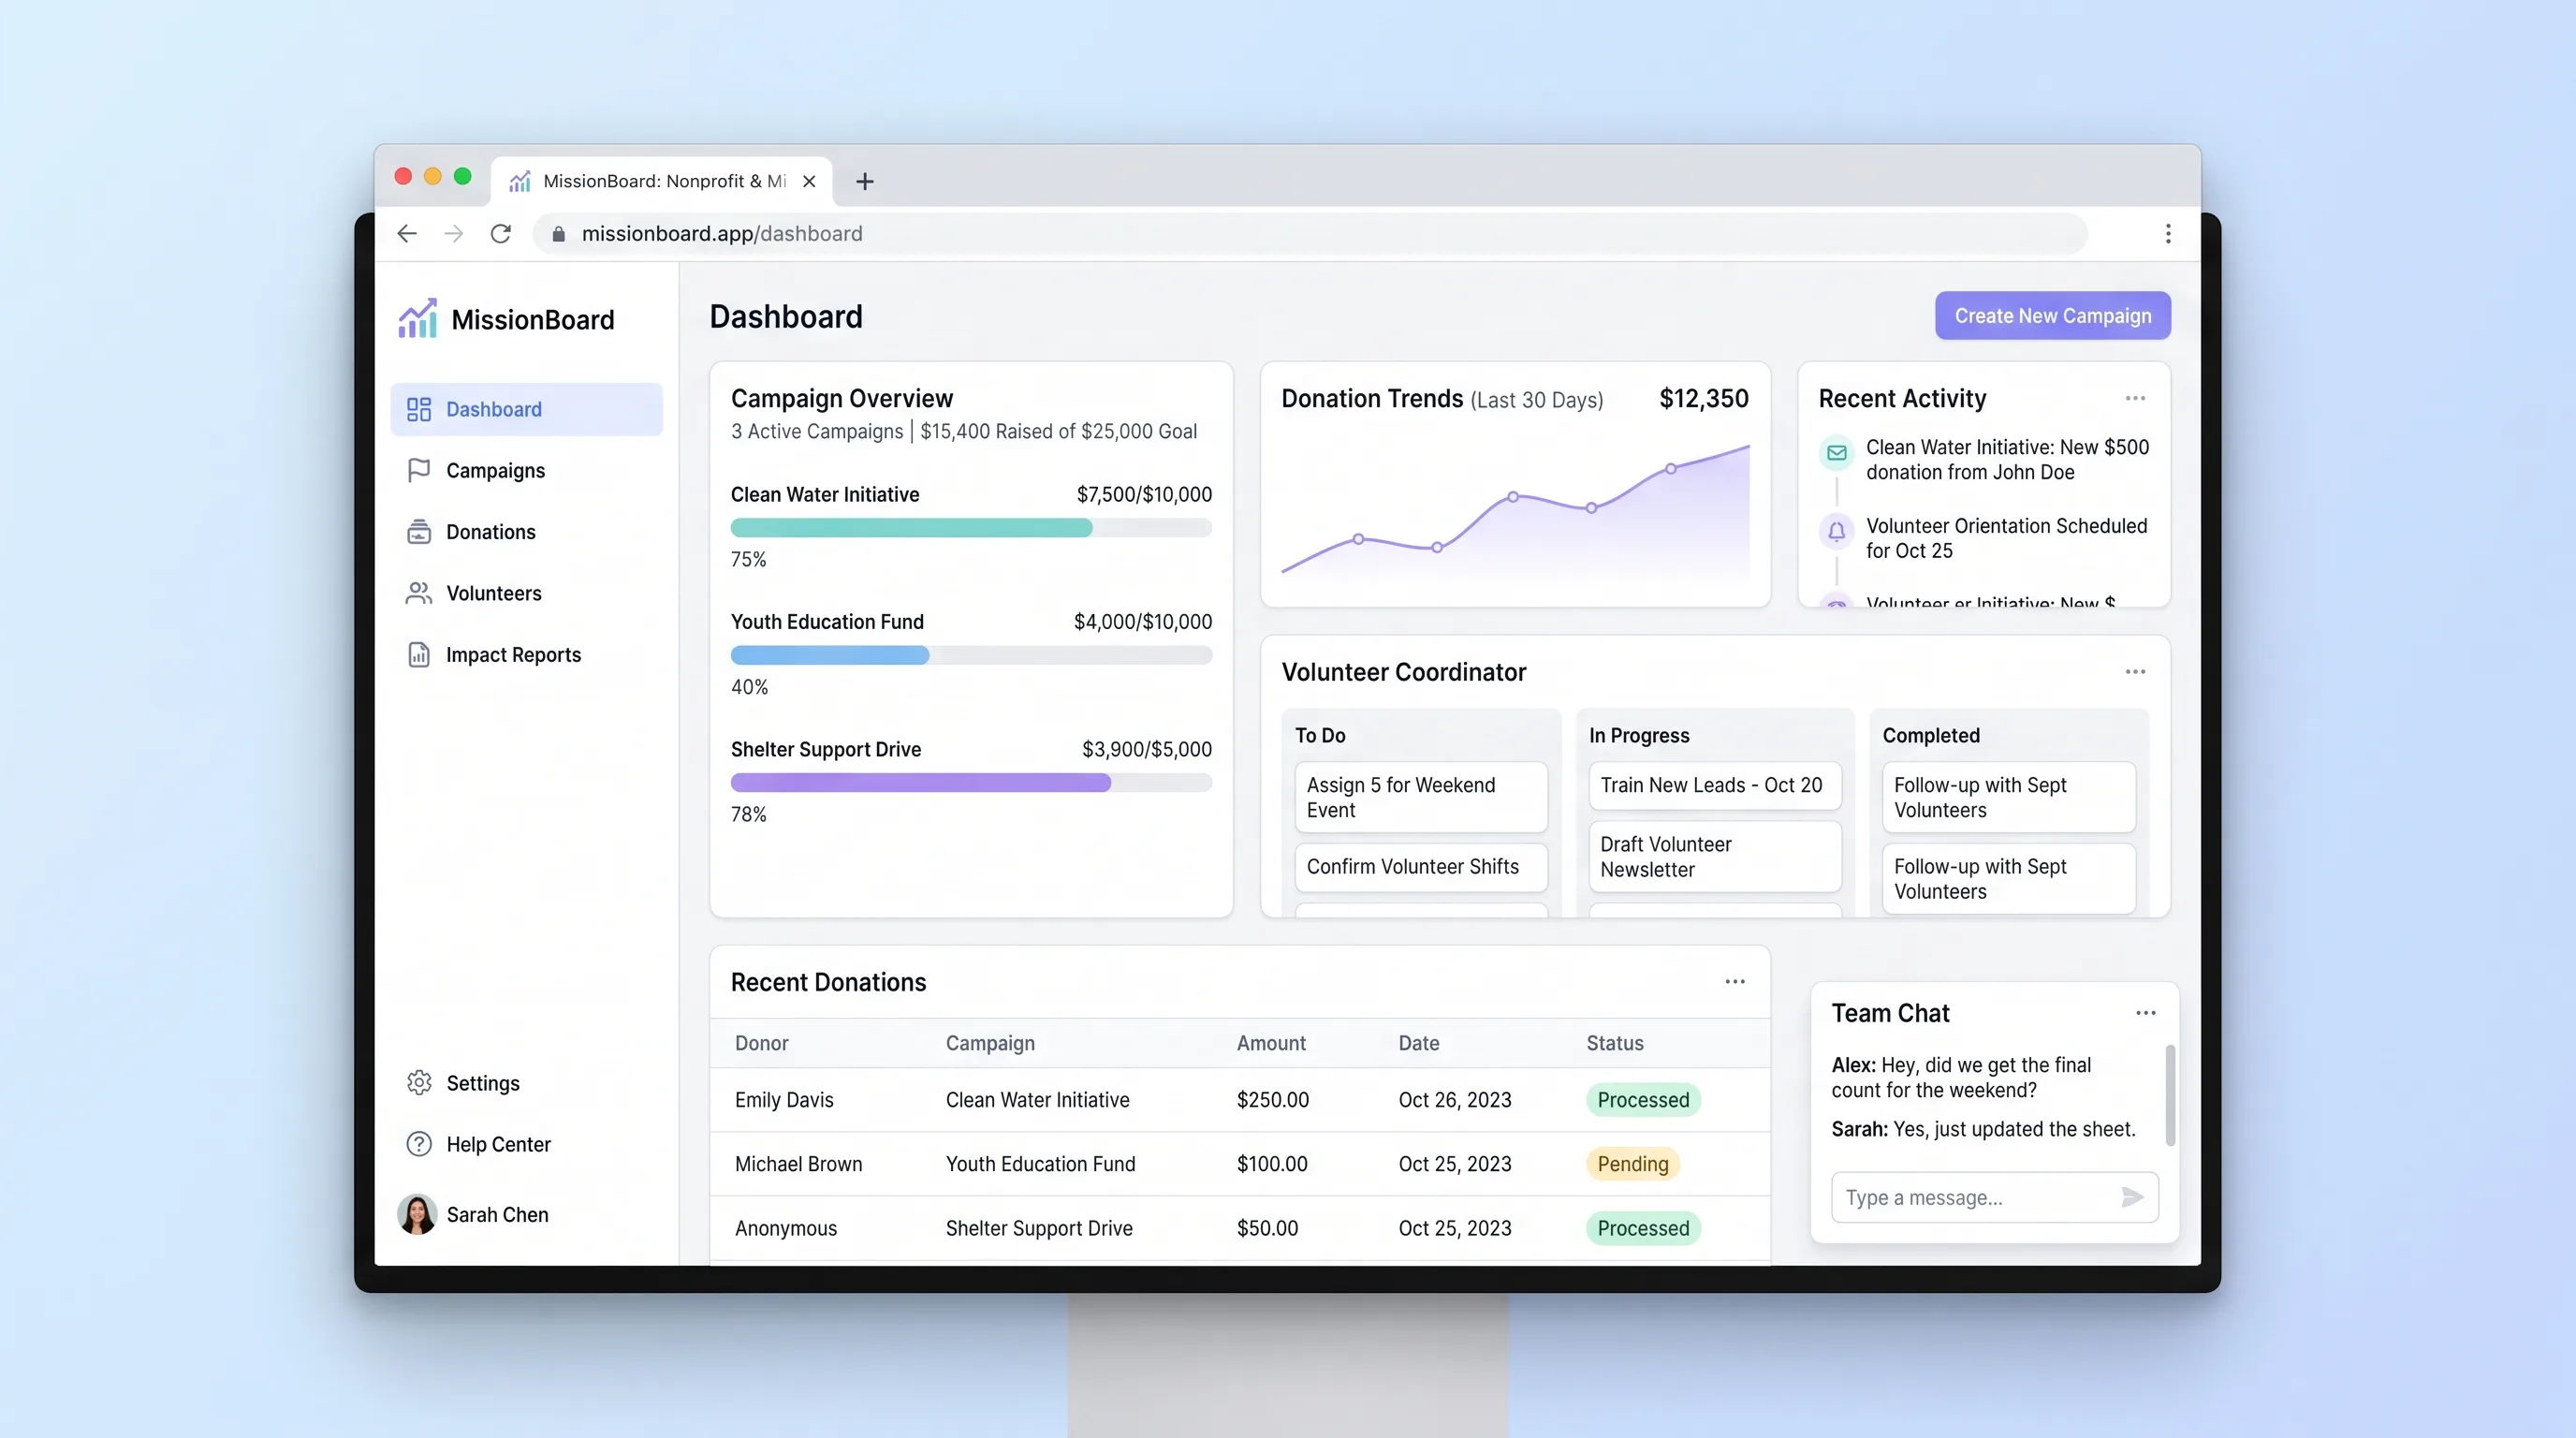
A shared operations hub for small nonprofits and ministry teams to coordinate campaigns, reconcile contributions and volunteer work, and report outcomes.
Internal ToolSales & Marketing
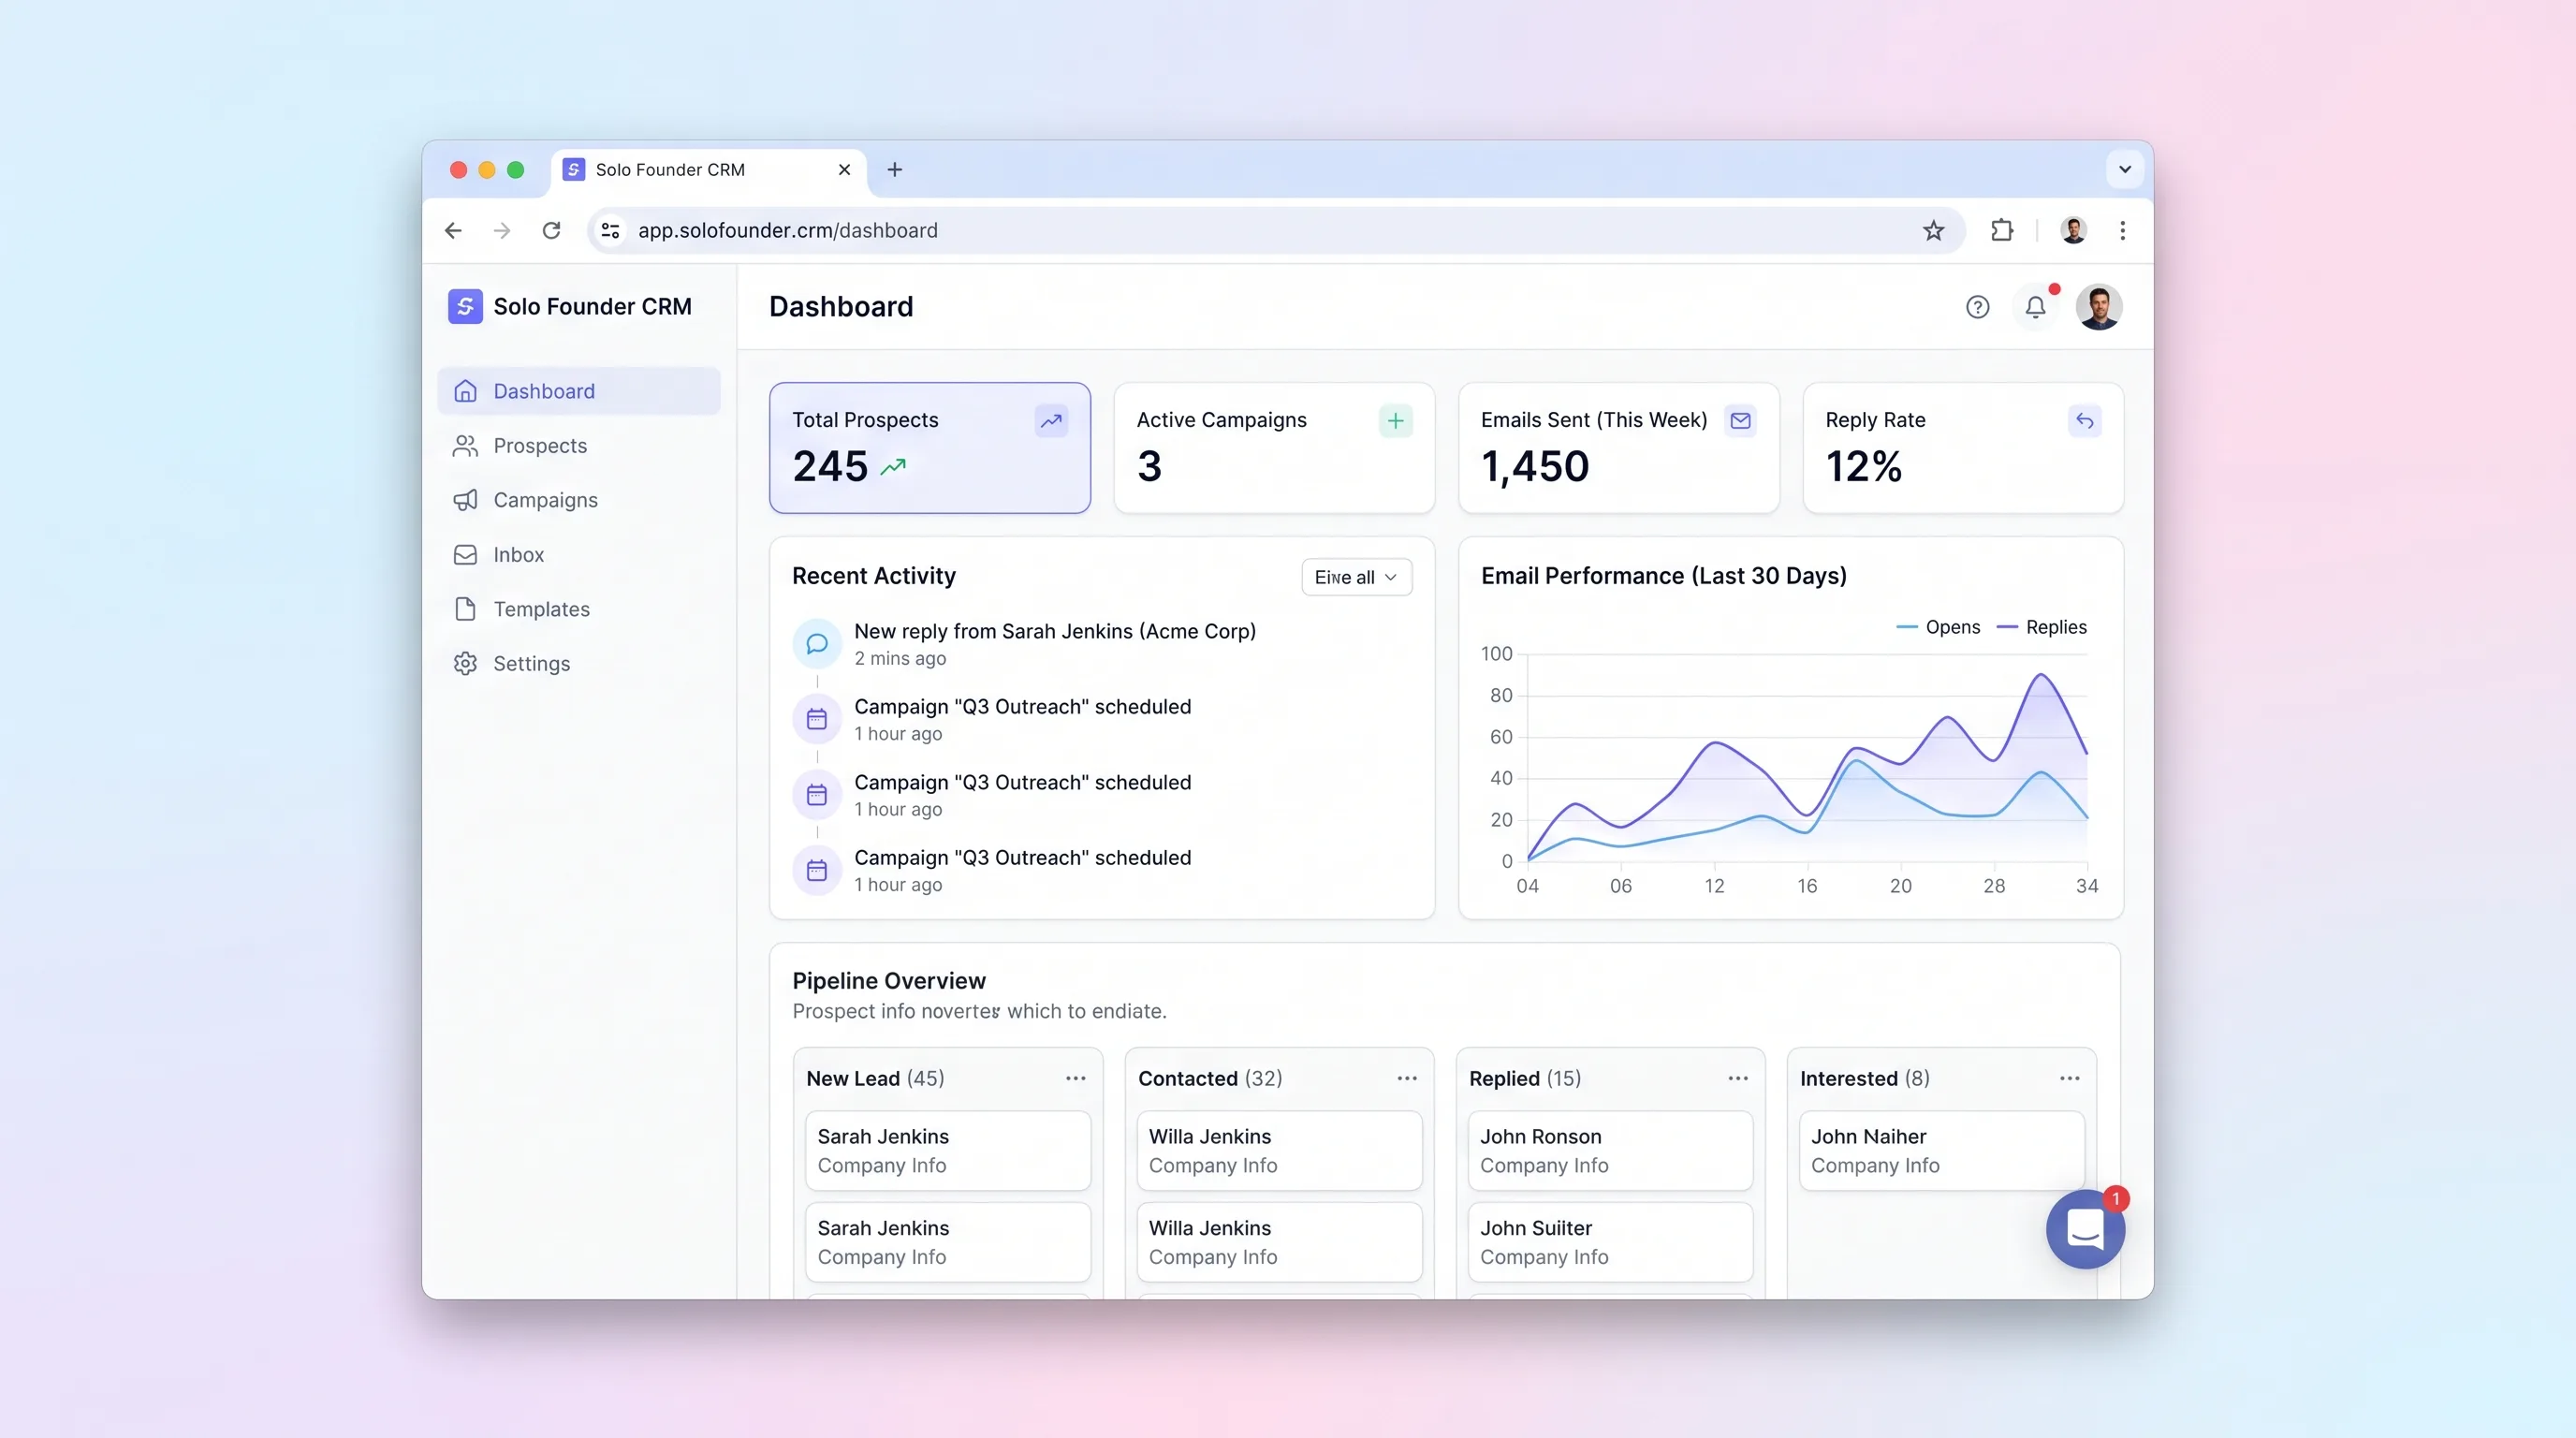
A lightweight founder sales desk for importing prospects, enrolling approved contacts in short email sequences, tracking replies, and stopping outreach safely.
Internal ToolBusiness Operations
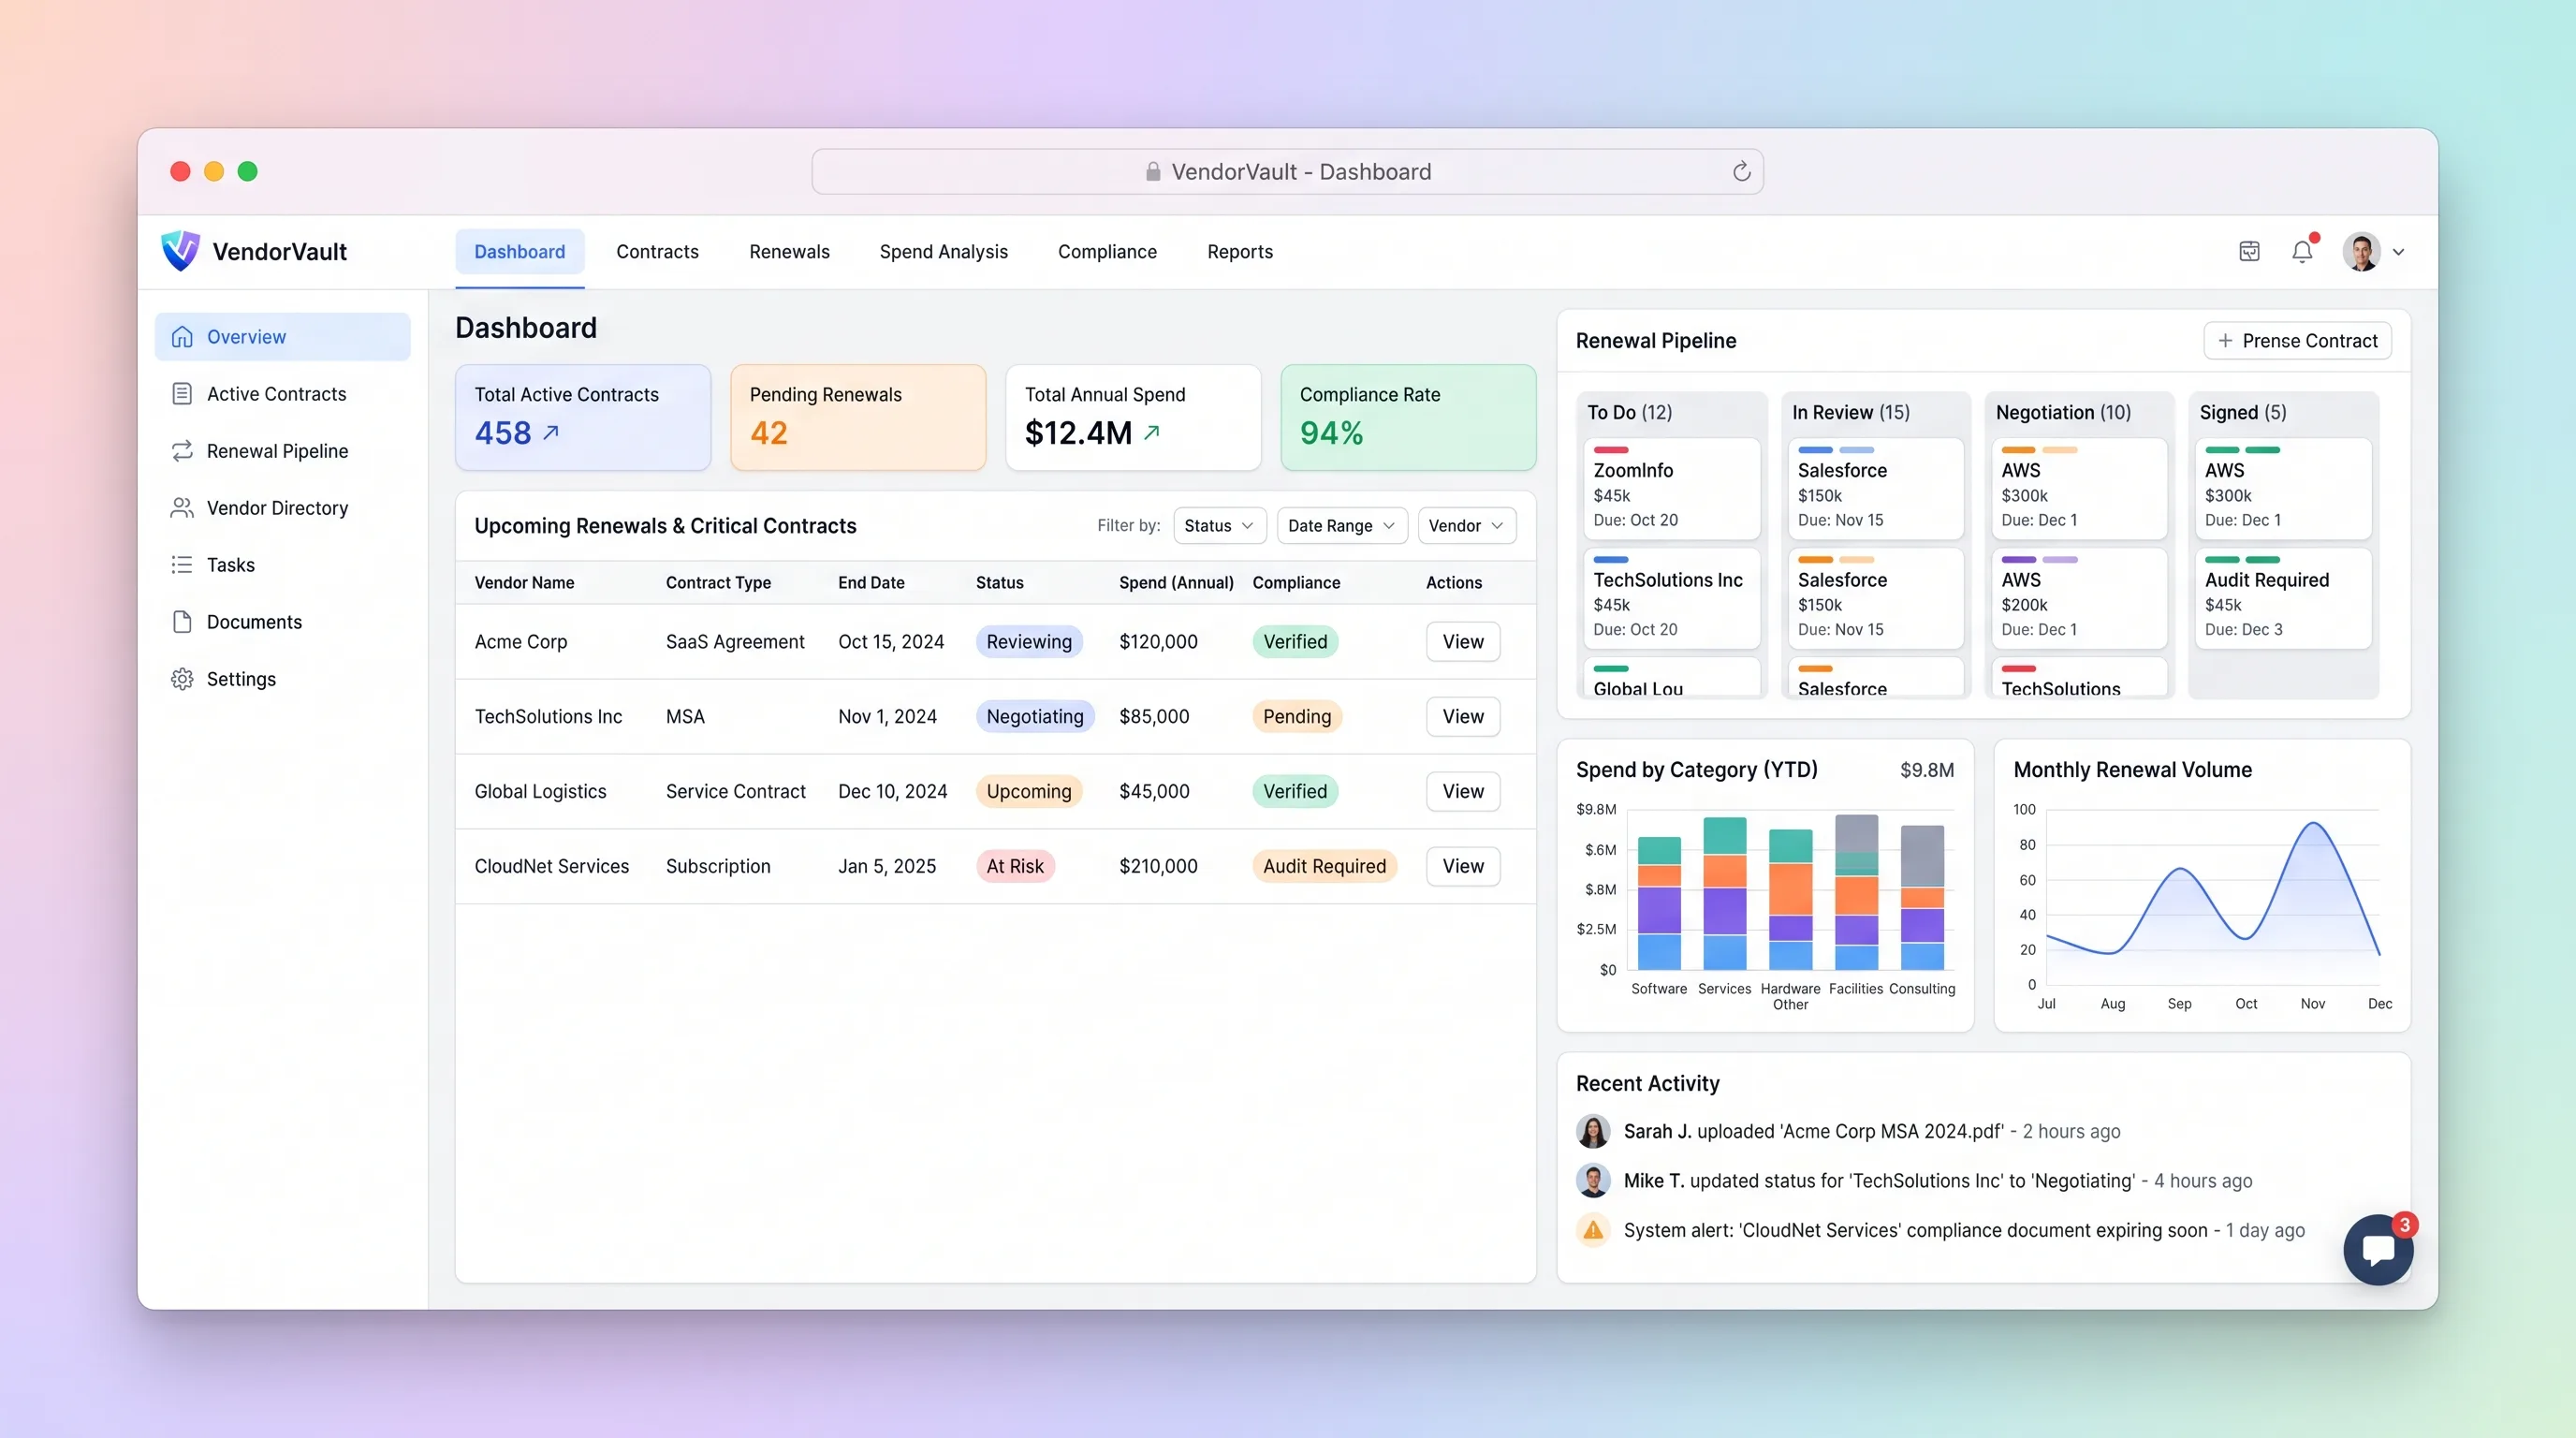
A procurement workspace that ties supplier contracts, renewal deadlines, owners, spend, and required documents to one accountable renewal pipeline.