Build this if
A small IT team needs reliable endpoint evidence and incident alerts but does not need a full telemetry suite.
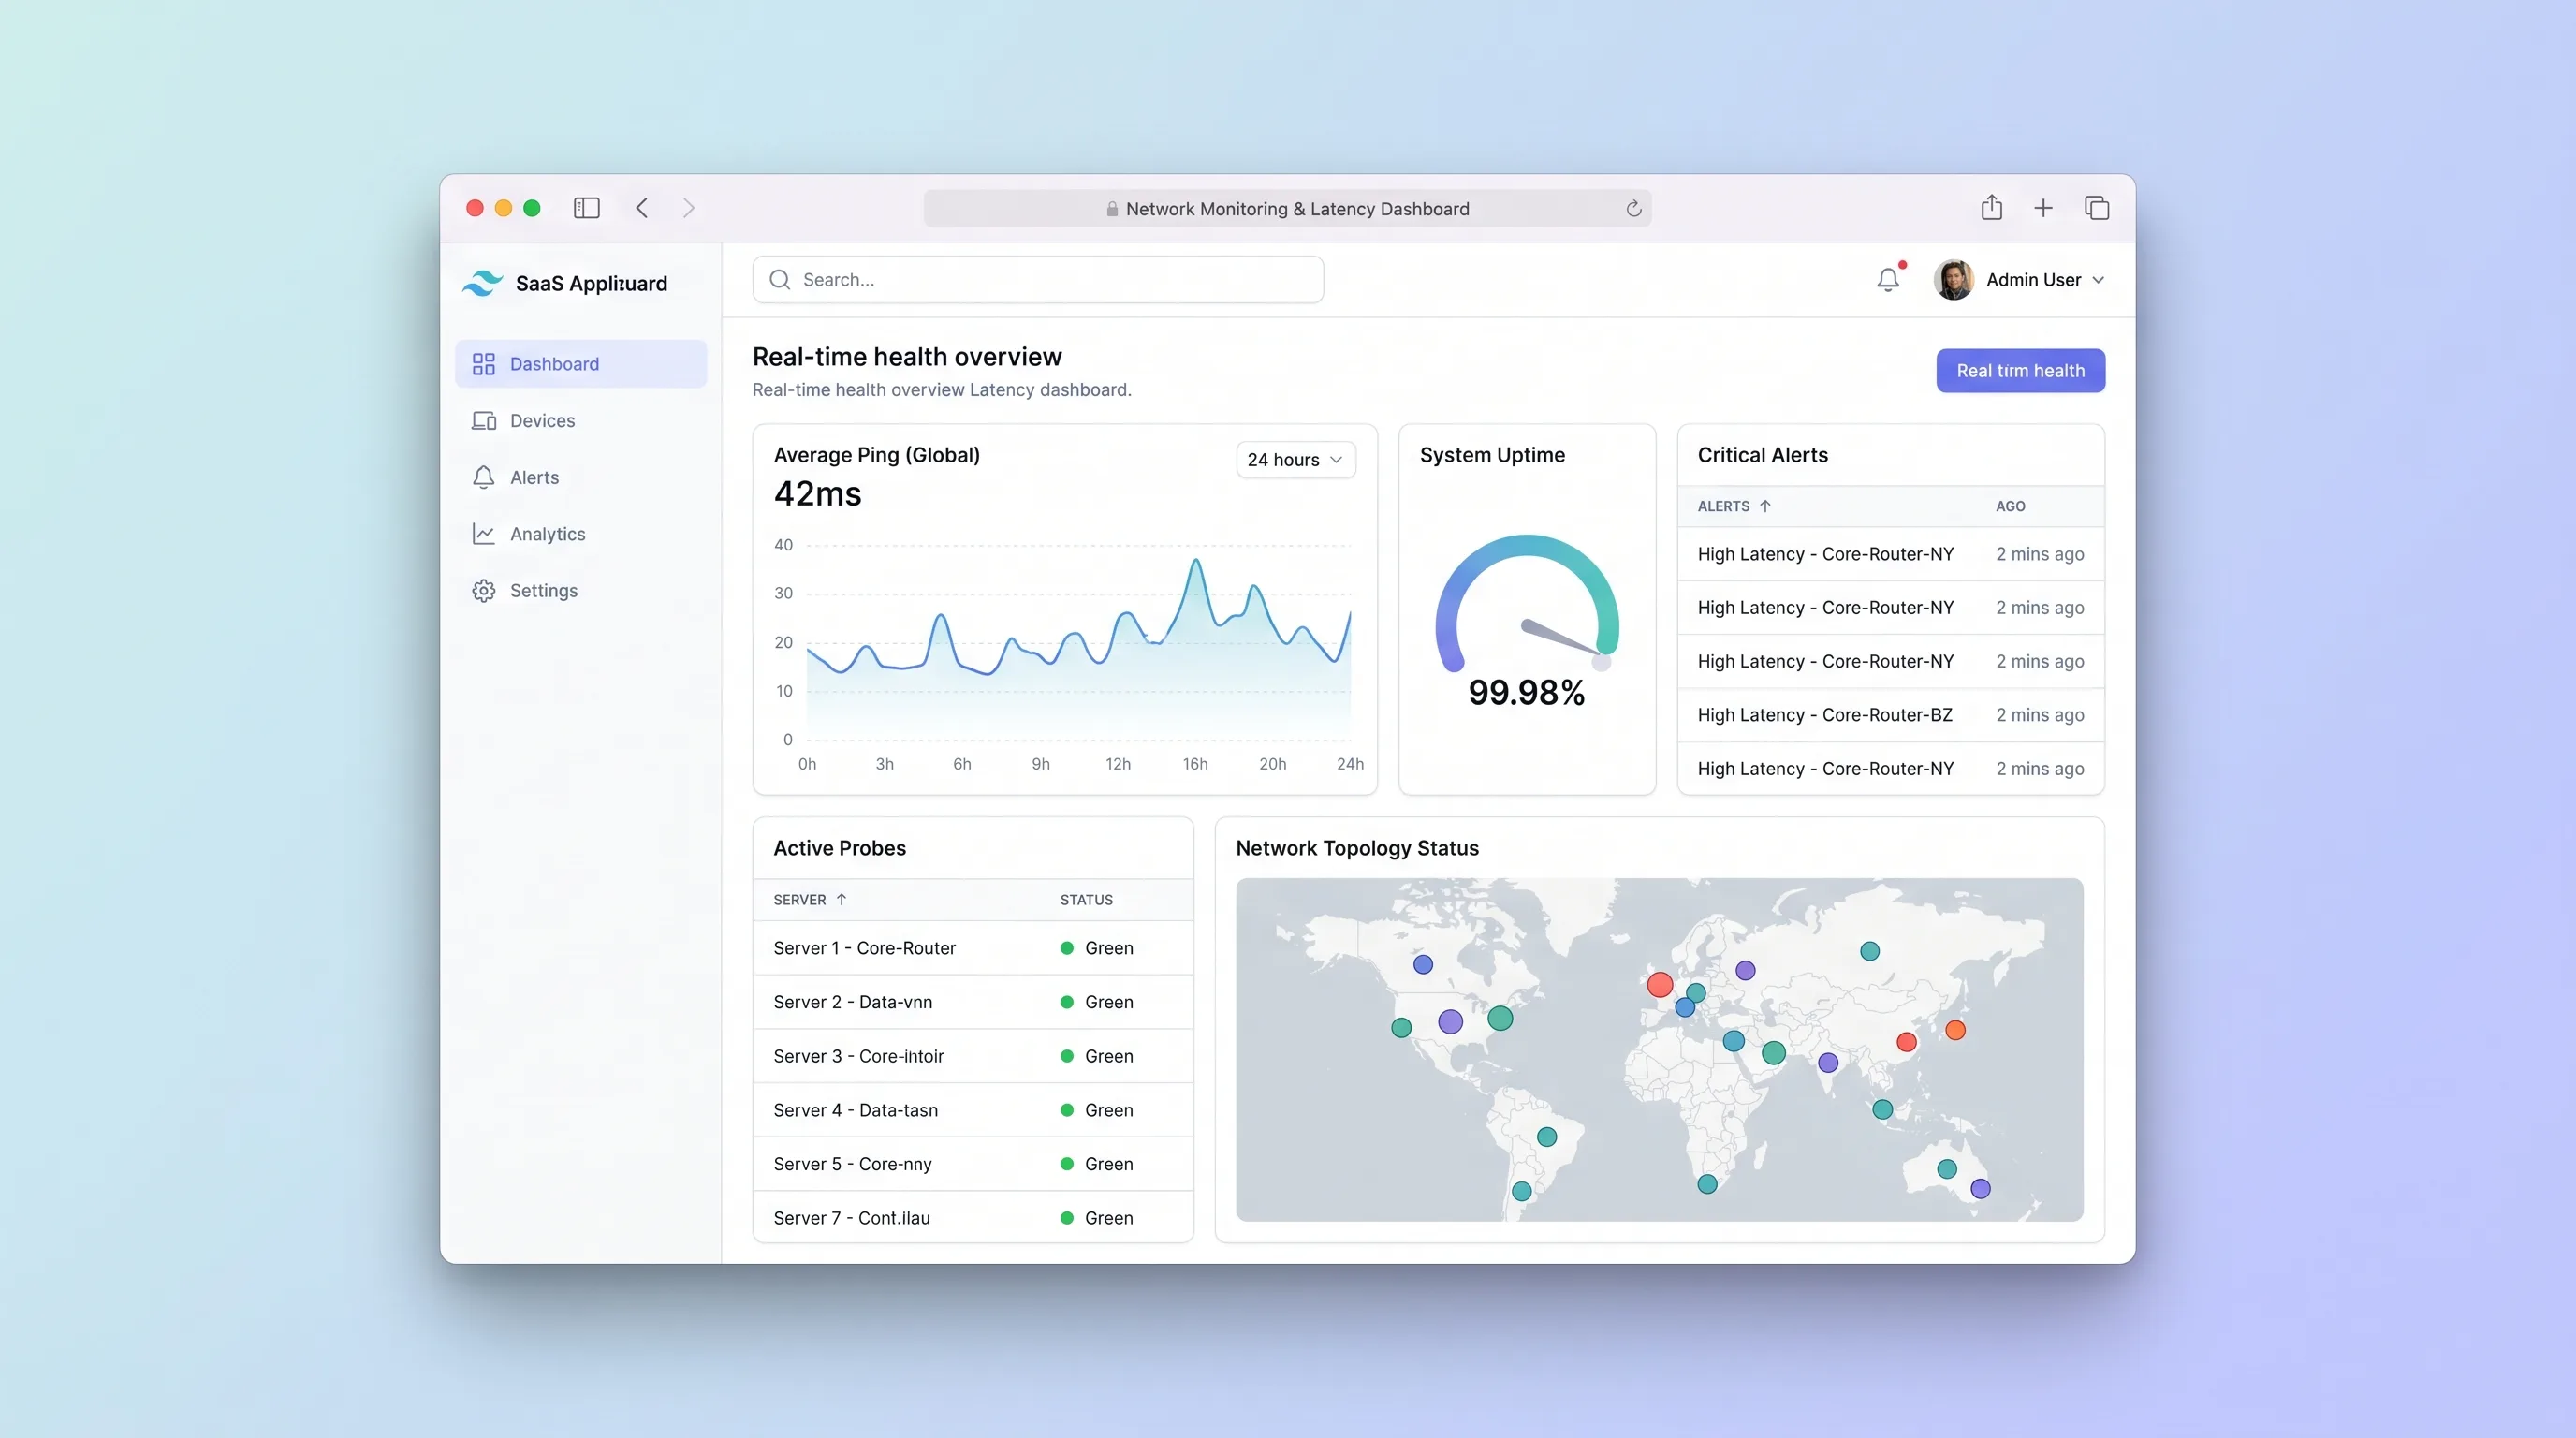
A focused uptime monitor for small IT teams that schedules endpoint checks, separates transient failures from incidents, and preserves alert and latency history.
Decision snapshot
A small IT team needs reliable endpoint evidence and incident alerts but does not need a full telemetry suite.
The main requirement is logs, traces, application profiling, automated remediation, or a globally distributed SLA platform.
Monitor a controlled endpoint for one week, inject timeout and latency failures, stop the worker once, and verify incidents, gaps, alerts, and report math remain distinguishable.
Problem and target customer
Small IT teams often discover outages from users or run ad hoc ping checks without durable history. A single timeout can cause noise, while sustained latency degradation is hard to prove after the service recovers.
System administrators and managed IT providers responsible for tens to a few hundred HTTP or ICMP-reachable endpoints without a full observability platform.
Monthly subscription tiered by monitored endpoints, check frequency, and history retention.
Editorial note
The monitoring worker is part of the product's truth model. If it stops checking, the console must show missing evidence rather than confidently declaring every target unavailable.
Consecutive-result policies keep a single timeout from becoming an incident while still preserving the raw check. Operators can tune sensitivity without rewriting history.
The monthly report is only credible when paused periods and collection gaps are visible. A polished uptime percentage without its denominator would undermine the tool's main value.
Choose your next step
Evaluate the operating tradeoffs quickly, or inspect how to build the MVP.
Compare the three operating paths at the default workload before opening the full calculator.
See cost preview Build this ideaInspect the build blueprintReview MVP scope, workflow, states, data rules, architecture, and acceptance criteria.
Open blueprintEvaluation preview
Directional infrastructure estimates for the current 500,000 endpoint checks assumption. Open the full calculator when you are ready to change it.
Managed web, database, queue, and continuous worker services.
Lowest operating effortOne or two cloud servers run the console, database, queue, and probes.
Lowest baseline costDedicated application, database, and worker bundles for more checks and retention.
Most separation and controlBuild blueprint
Product goal
MVP scope
UX and user flow
Show endpoint state, current latency, active incidents, last check, and worker freshness.
Display configuration, recent checks, latency percentiles, gaps, and incident bands.
Preserve trigger evidence, alert delivery, acknowledgement, recovery, and operator notes.
Calculate uptime and latency summaries for a selected endpoint set and date range.
Core entity outline
Defines the target, protocol, check cadence, timeout, and active policy.
Stores one immutable check outcome used for charts and reports.
Defines repeated-failure, degradation, and recovery thresholds.
Groups a continuous unhealthy period and its operator response.
Distinguishes target problems from stale monitoring execution.
Architecture and data flow
Render configuration, health, charts, incidents, and report controls.
Lease due checks without dispatching duplicates.
Execute bounded network checks and emit normalized outcomes and heartbeats.
Open, update, and resolve incidents from ordered results.
Persist endpoints, checks, policies, incidents, alerts, and worker health.
Deliverables and acceptance
Recommended stack
Build a responsive technical console and report surface.
Retain relational incident state and query time-ordered probe results efficiently.
Lease scheduled probes, bound concurrency, and observe queue lag.
Execute explicit HTTP and ICMP checks with normalized timeouts and errors.
Send incident and recovery alerts while retaining delivery outcomes.
Monitoring credibility comes from separating target state, scheduler state, and worker state. A dedicated probe process and immutable results make incident and report calculations reviewable without an AI layer.
Copy the build prompt, model the operating cost, and choose where to deploy.
Execution
Once the blueprint is clear, use the prompt, cost model, and deployment options to start building.
Build prompt
Build a Next.js operations console backed by PostgreSQL and a dedicated Node.js probe worker. Use deterministic thresholds and consecutive-check rules; do not add LLM incident analysis.
Build prompt
Open the prompt pack whenever you are ready to take this blueprint into your builder.
Build prompt ready
Copy the prompt into your builder, then use the cost model below to choose how you want to run it.
Use the cost model to choose a deployment path that matches the build plan.
Cost calculator
A technical run-cost estimate for the first production version. Team, acquisition, payment fees, and business COGS are excluded.
$10-$40 per 500,000 endpoint checks
Low and high values allow for usage variance and plan headroom.
Managed web, database, queue, and continuous worker services.
500K endpoint checks included, then $5-$20 per 500K endpoint checksThe estimate combines the selected infrastructure path, required operating modules, selected optional modules, and usage above included monthly allowances. Taxes and regional uplifts are excluded.
Deployment options
Choose based on operating preference, not only the headline price.
Deploy console, database, Redis, and worker with visible service boundaries.
Continuous probe compute can exceed the minimum plan spend.
Run the app, worker, and database on one small Vultr VPS with Docker Compose and explicit backups.
The same team must monitor, patch, and back up the monitoring server.
Separate application, worker, data, storage, and backup responsibilities as the workload grows.
Additional services add operational work and do not create geographic probe diversity by themselves.
Start building
Use Lovable to test endpoint setup, status cards, latency charts, incident detail, alert policy, and monthly report views with IT operators.
Open Lovable 02AutomationHandoff confirmed incidentsUse Make as optional glue to create a ticket or notify an existing operations channel only after the monitor opens or resolves an incident.
Open Make 03DeployRun the console and probe workerDeploy the web app, database, scheduler, and probe worker on Railway while keeping worker health visible separately from monitored endpoints.
Open RailwayKeep exploring
Internal ToolDeveloper & IT Operations
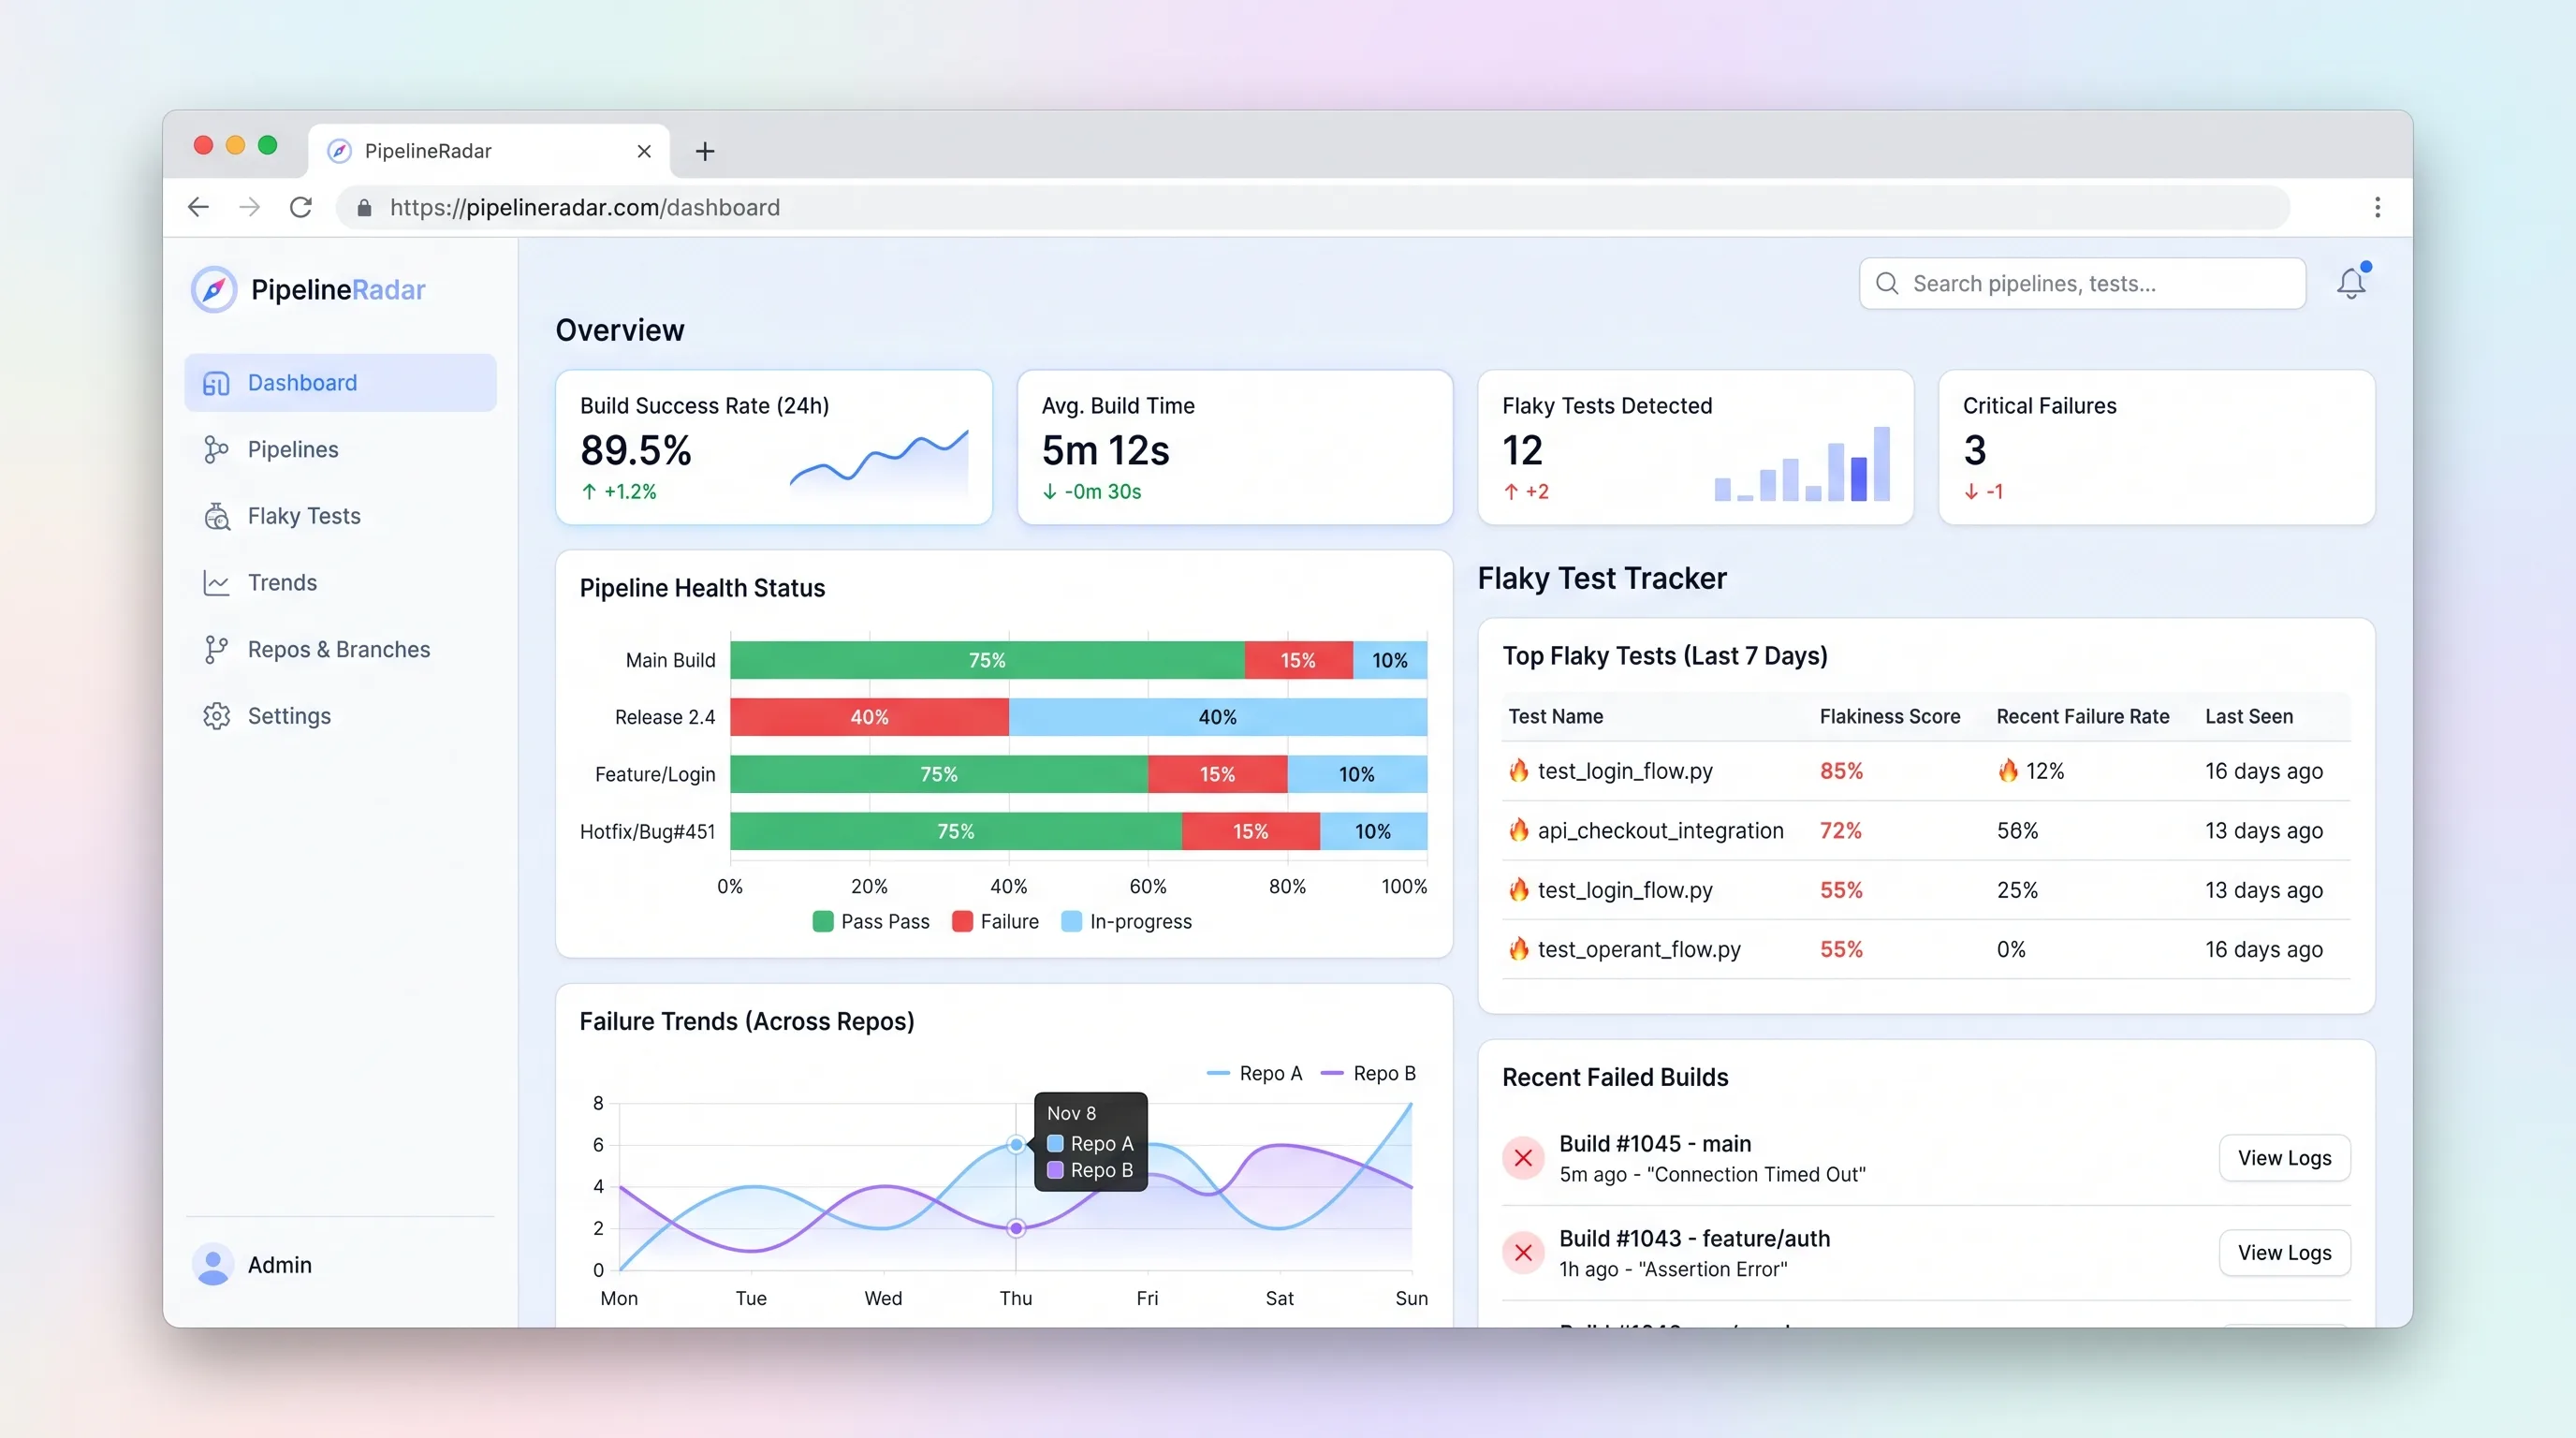
A focused CI/CD pipeline health monitor and flaky test tracker that ingests build events, ranks the top three flakiest tests per repo in under sixty seconds, and surfaces branch-level failure trends for indie developers and small.
Internal ToolDeveloper & IT Operations
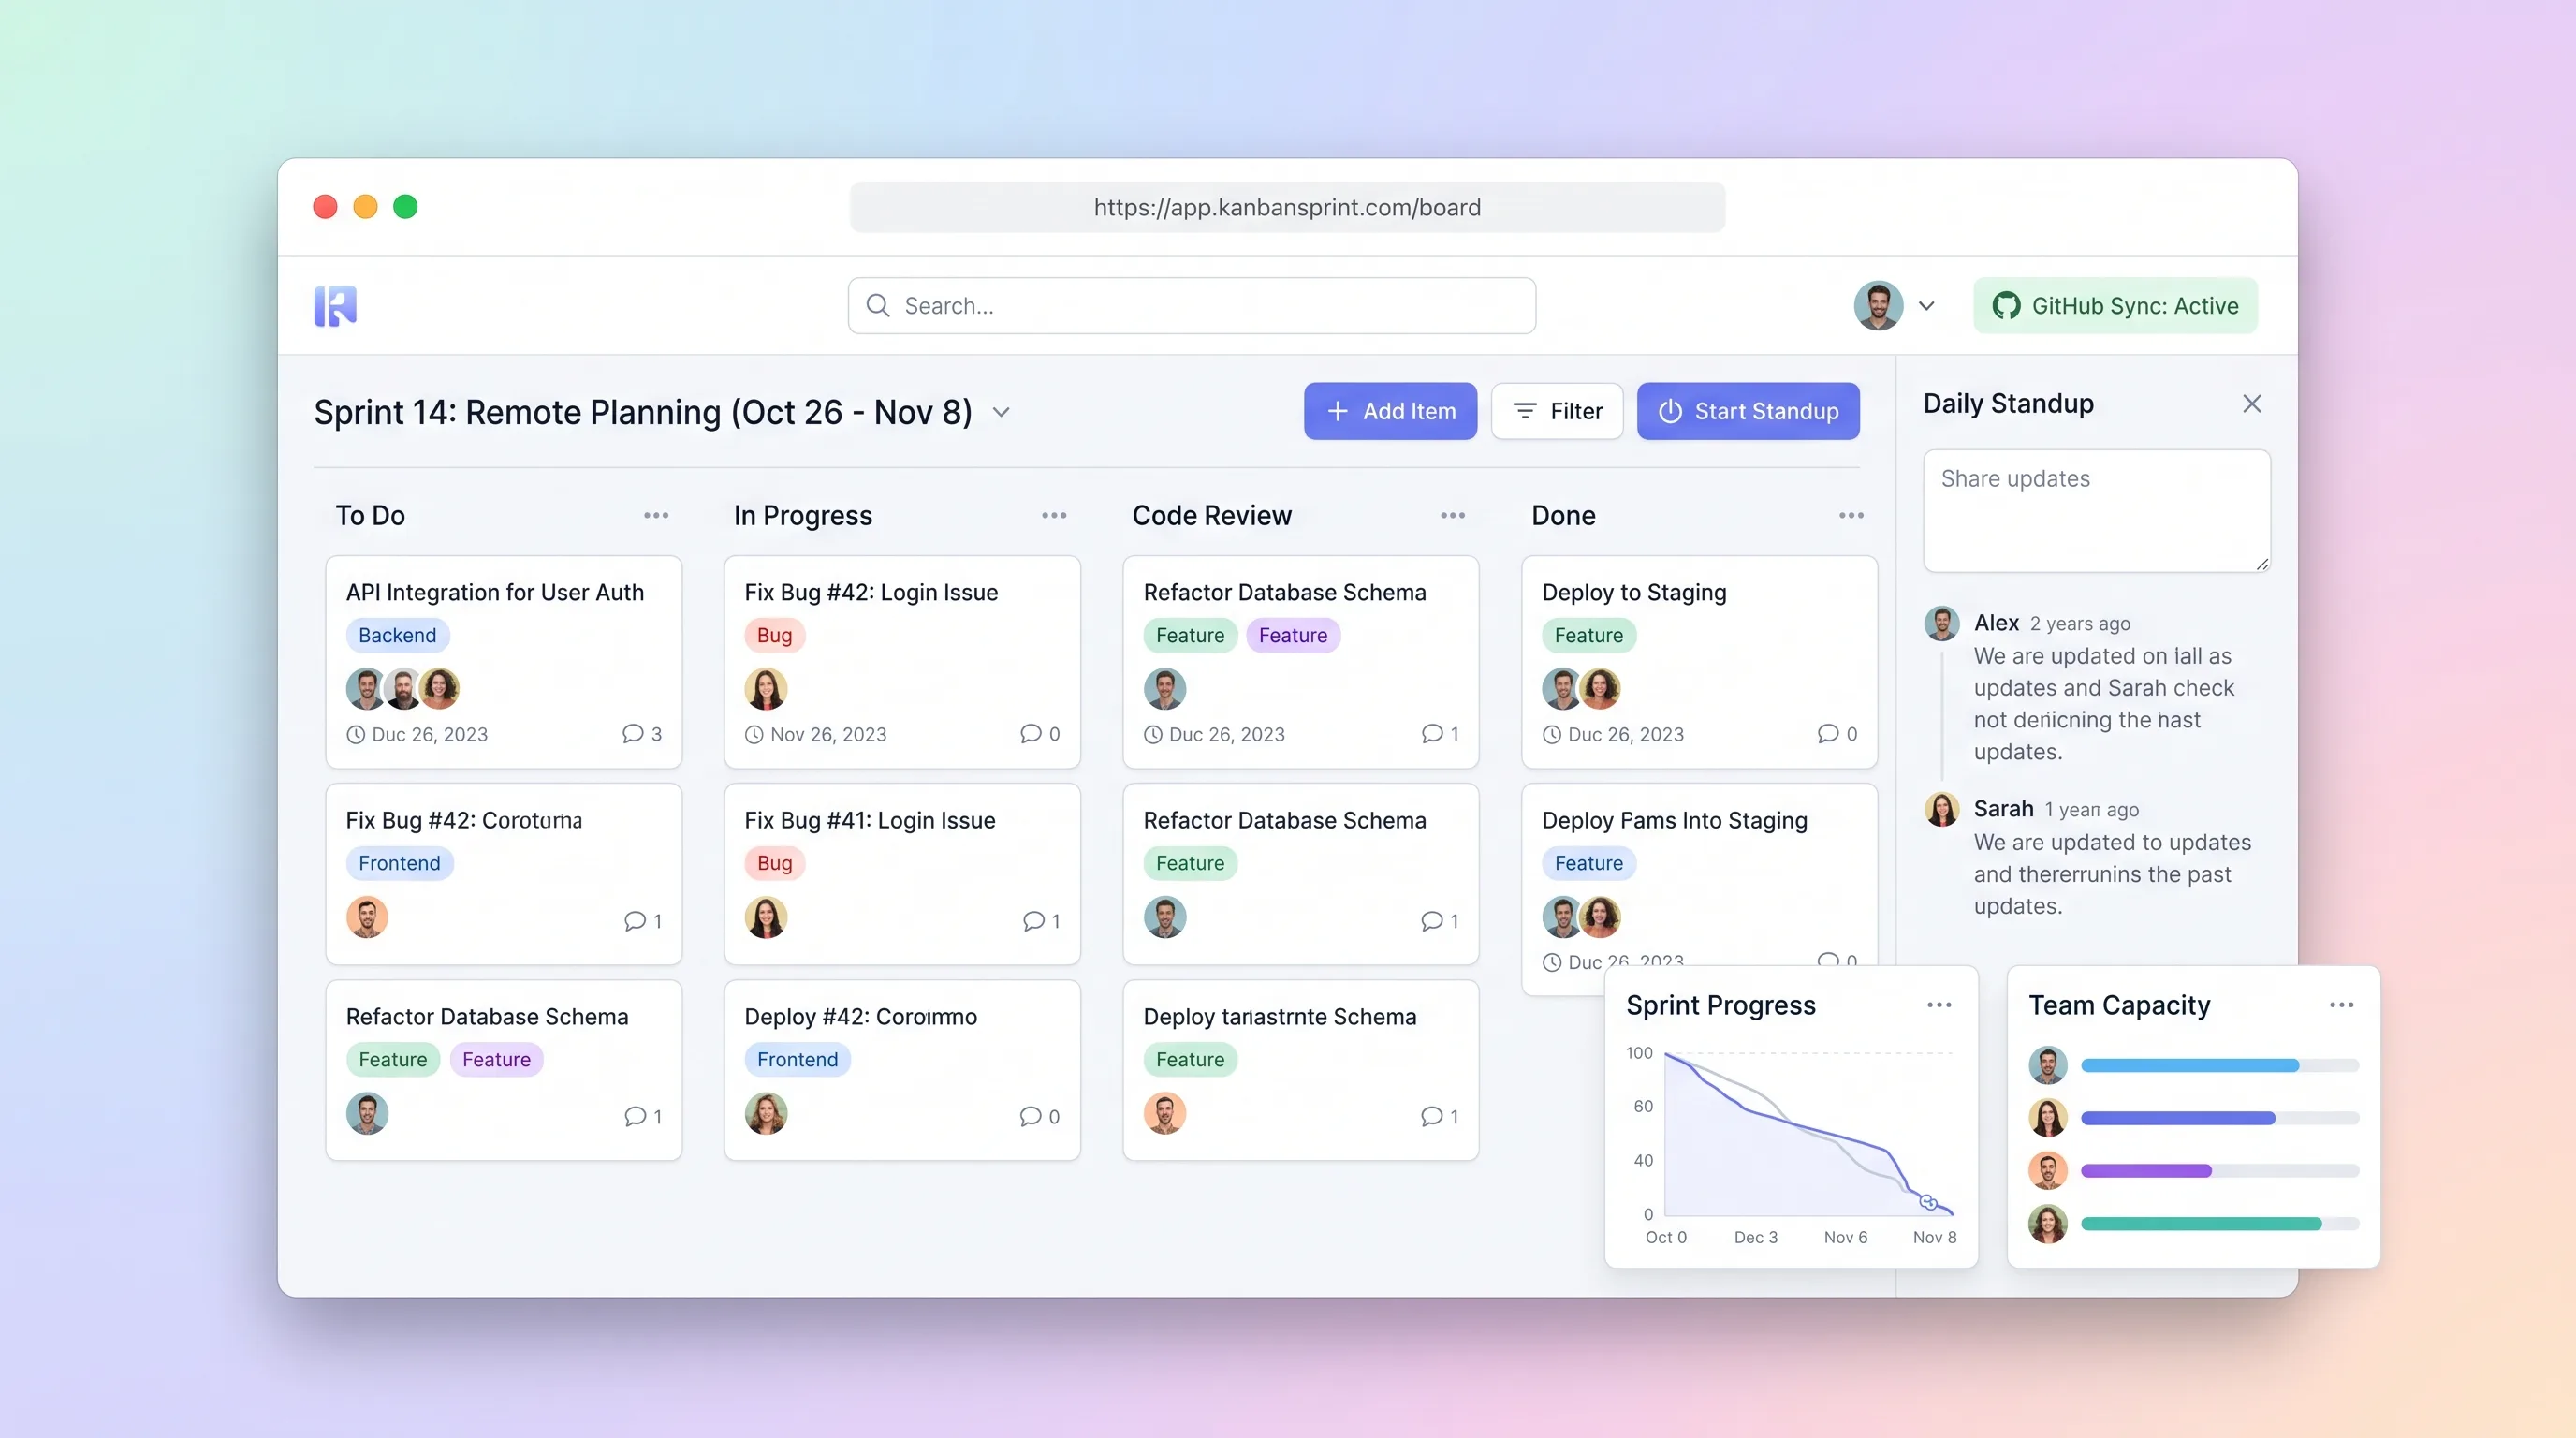
A compact planning workspace that keeps sprint commitments, GitHub issue state, board movement, daily blockers, and end-of-sprint carryover aligned.
Internal ToolDeveloper & IT Operations
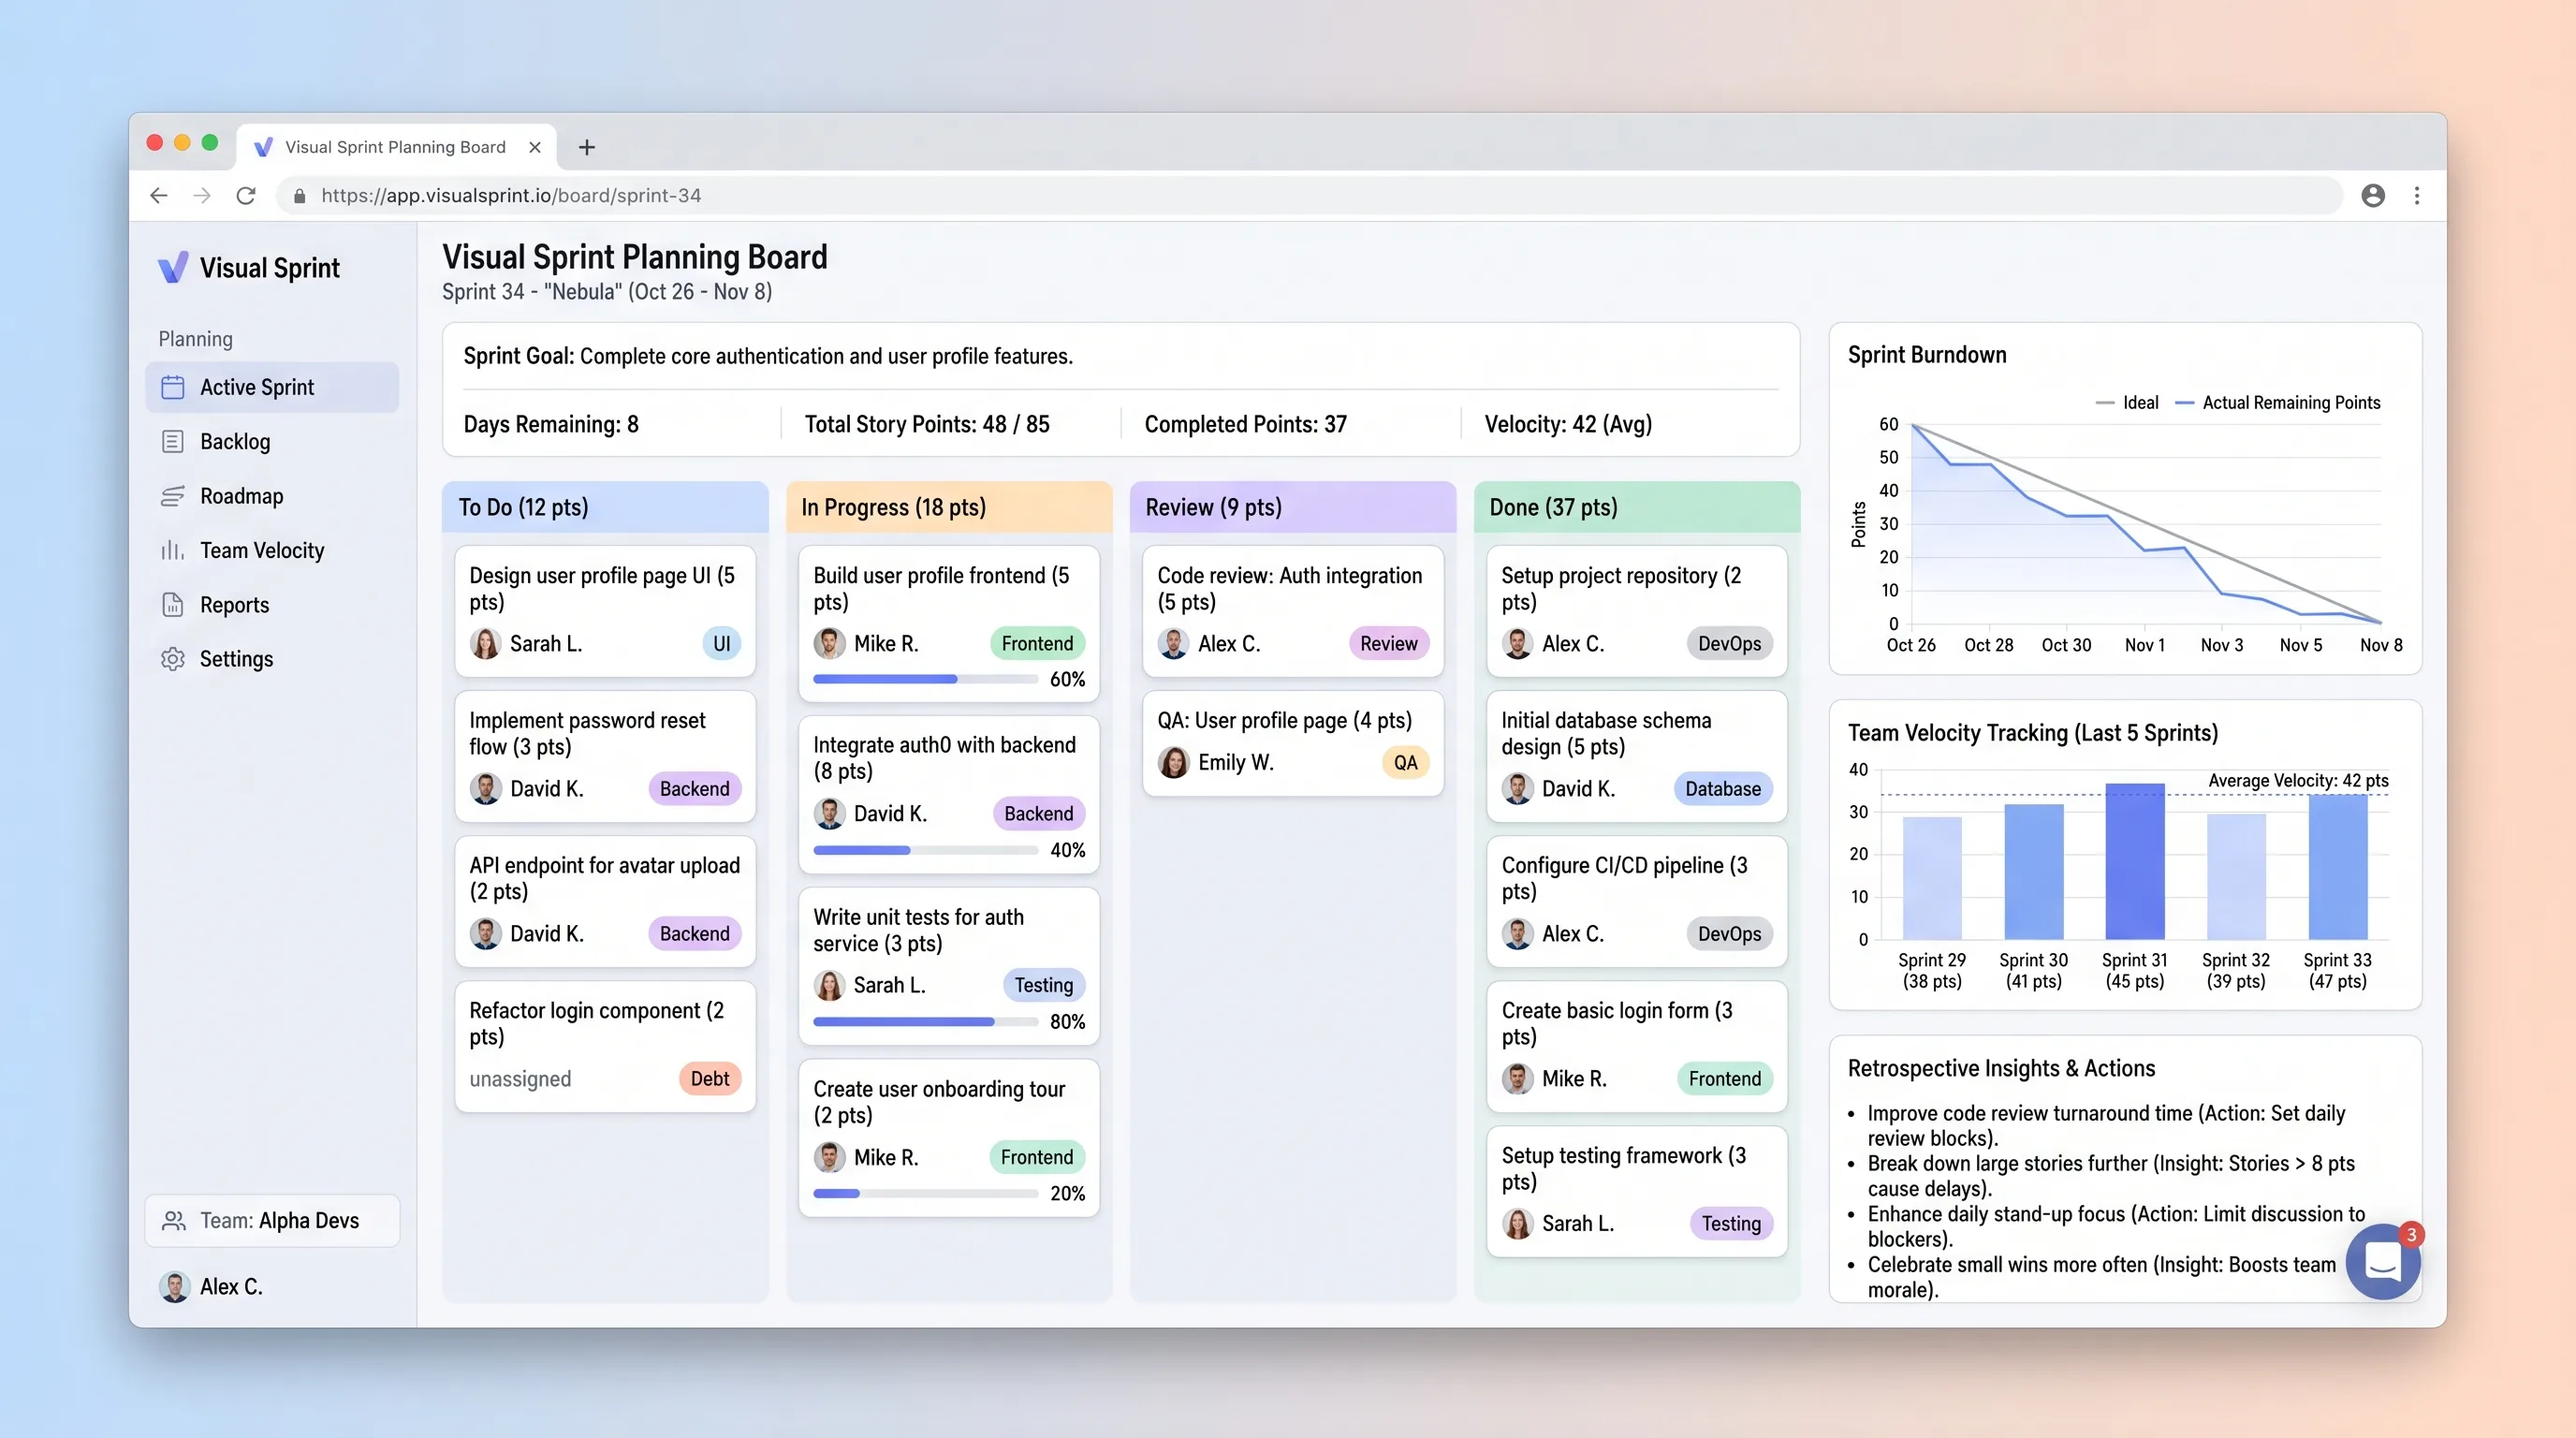
A sprint board that helps small development teams commit work against recent capacity, track story-point movement, and carry evidence into retrospectives.
Internal ToolDeveloper & IT Operations
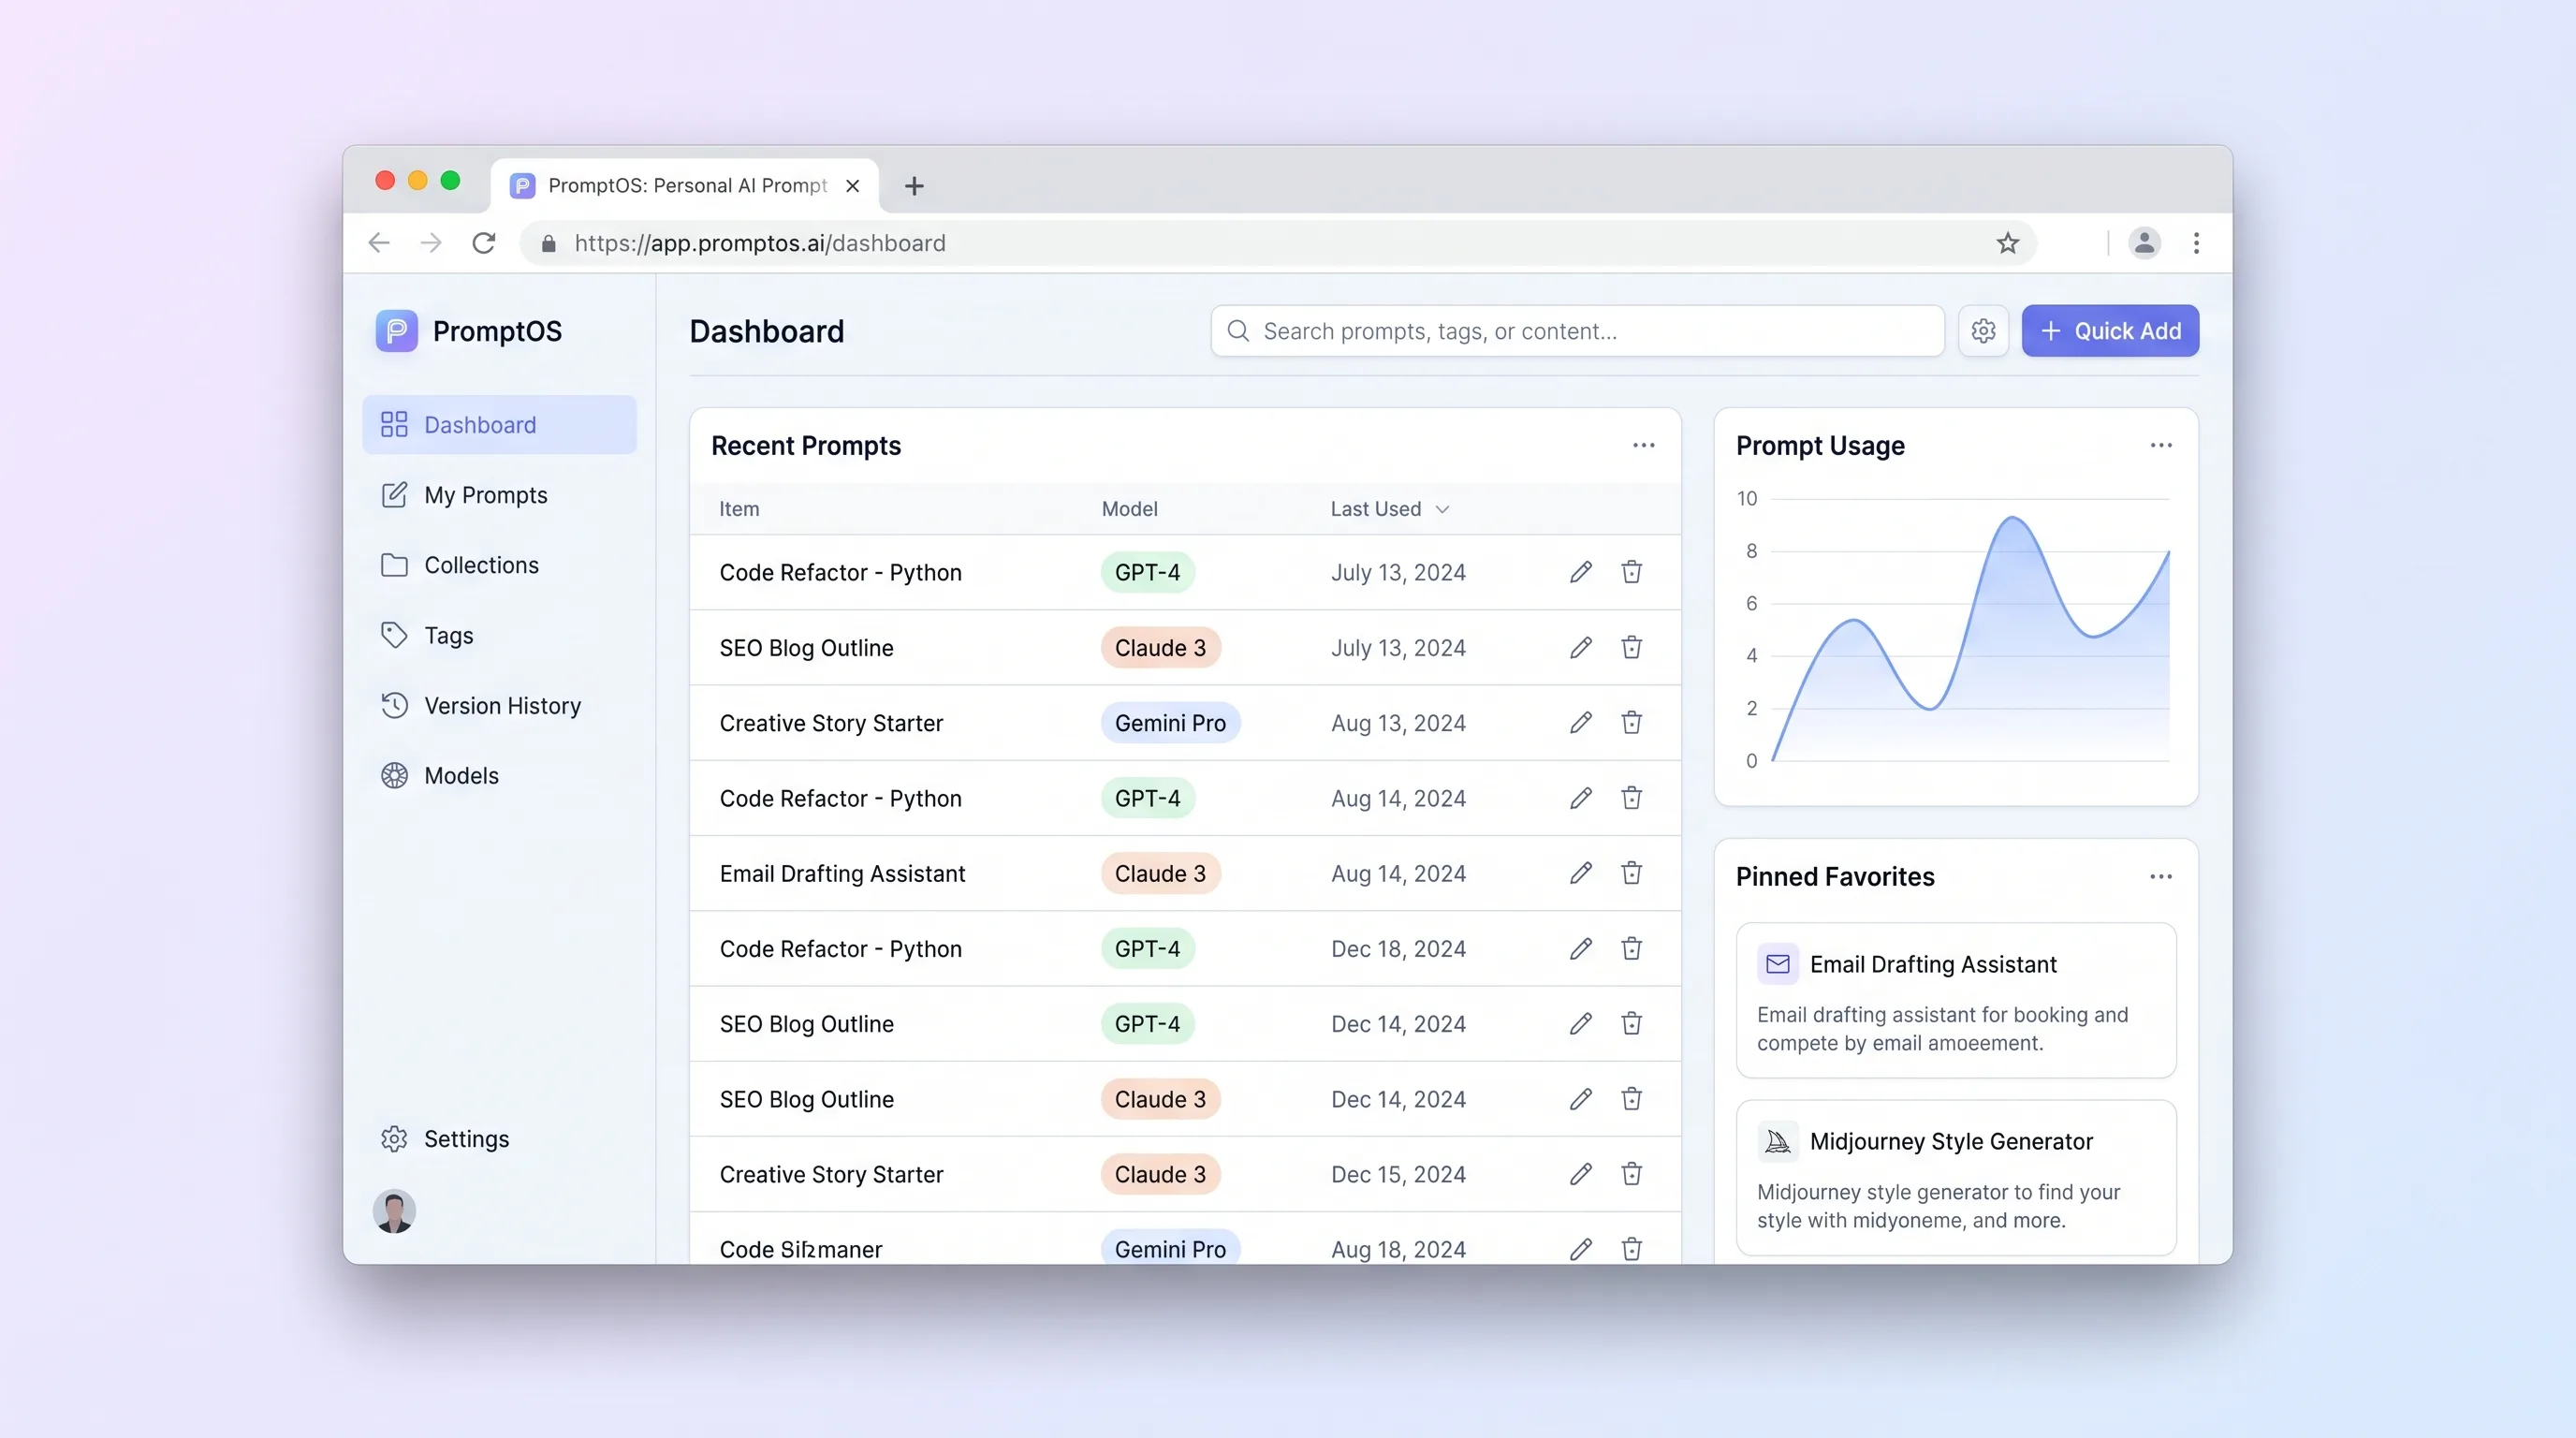
A private library for power users to save, tag, version, parameterize, and retrieve reusable prompts without depending on any model provider.
Internal ToolDeveloper & IT Operations
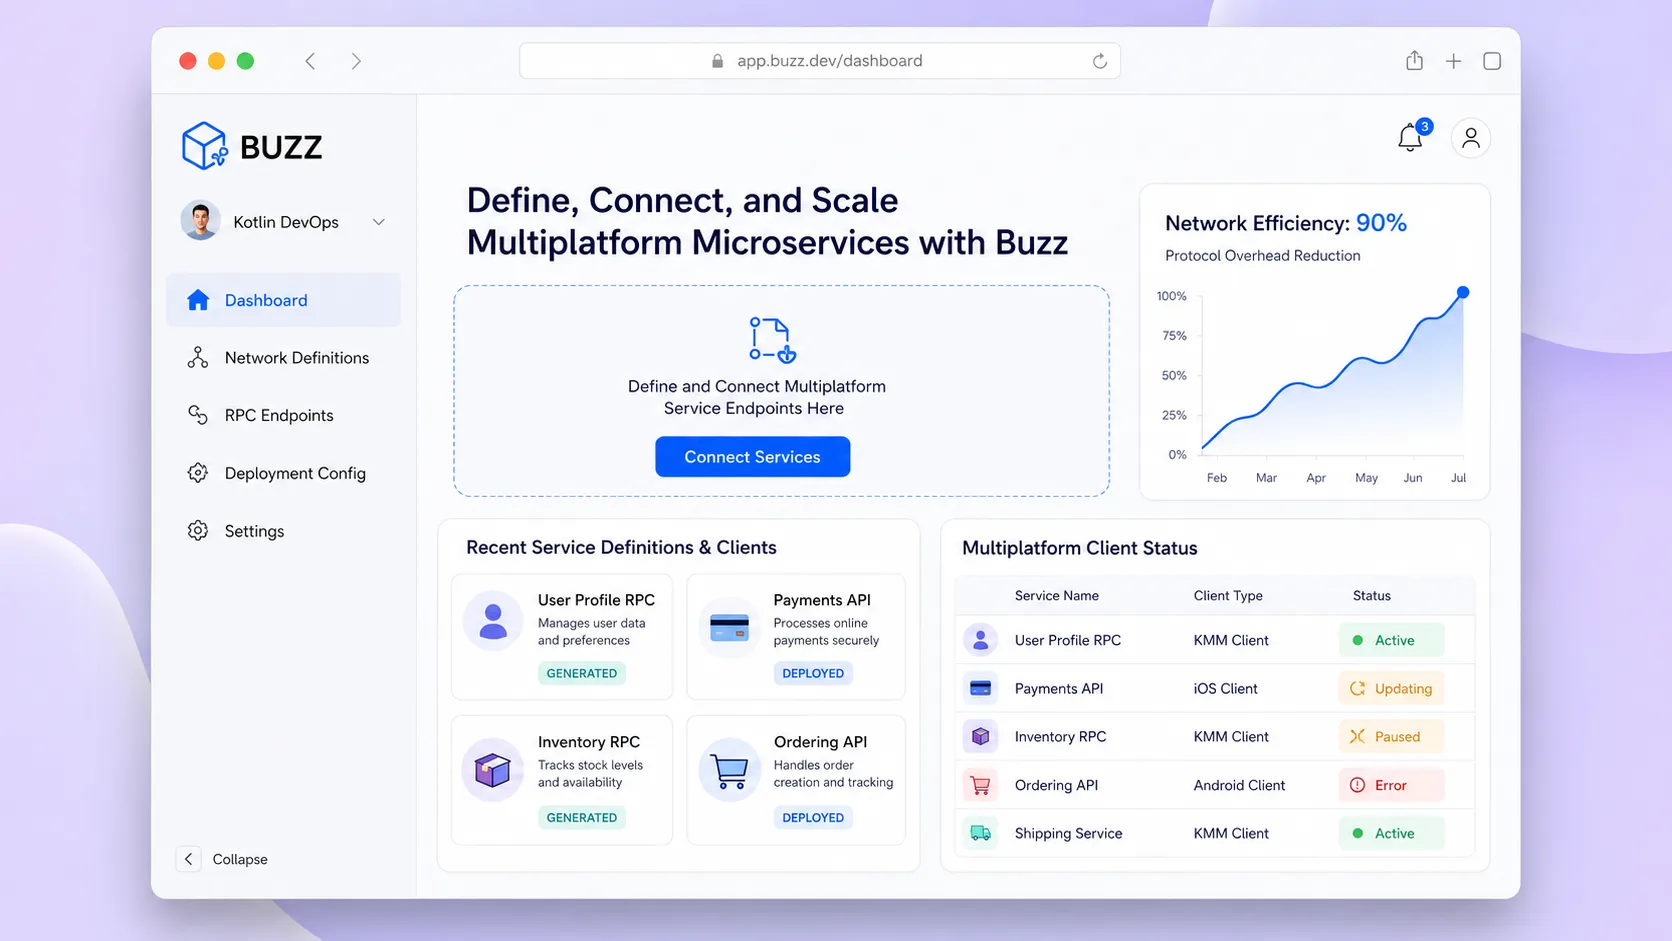
A self-hostable project workspace where humans and AI agents collaborate in signed rooms that unify conversation, code patches, workflow events, and approvals into one searchable, auditable event log.
Internal ToolEvents & Community
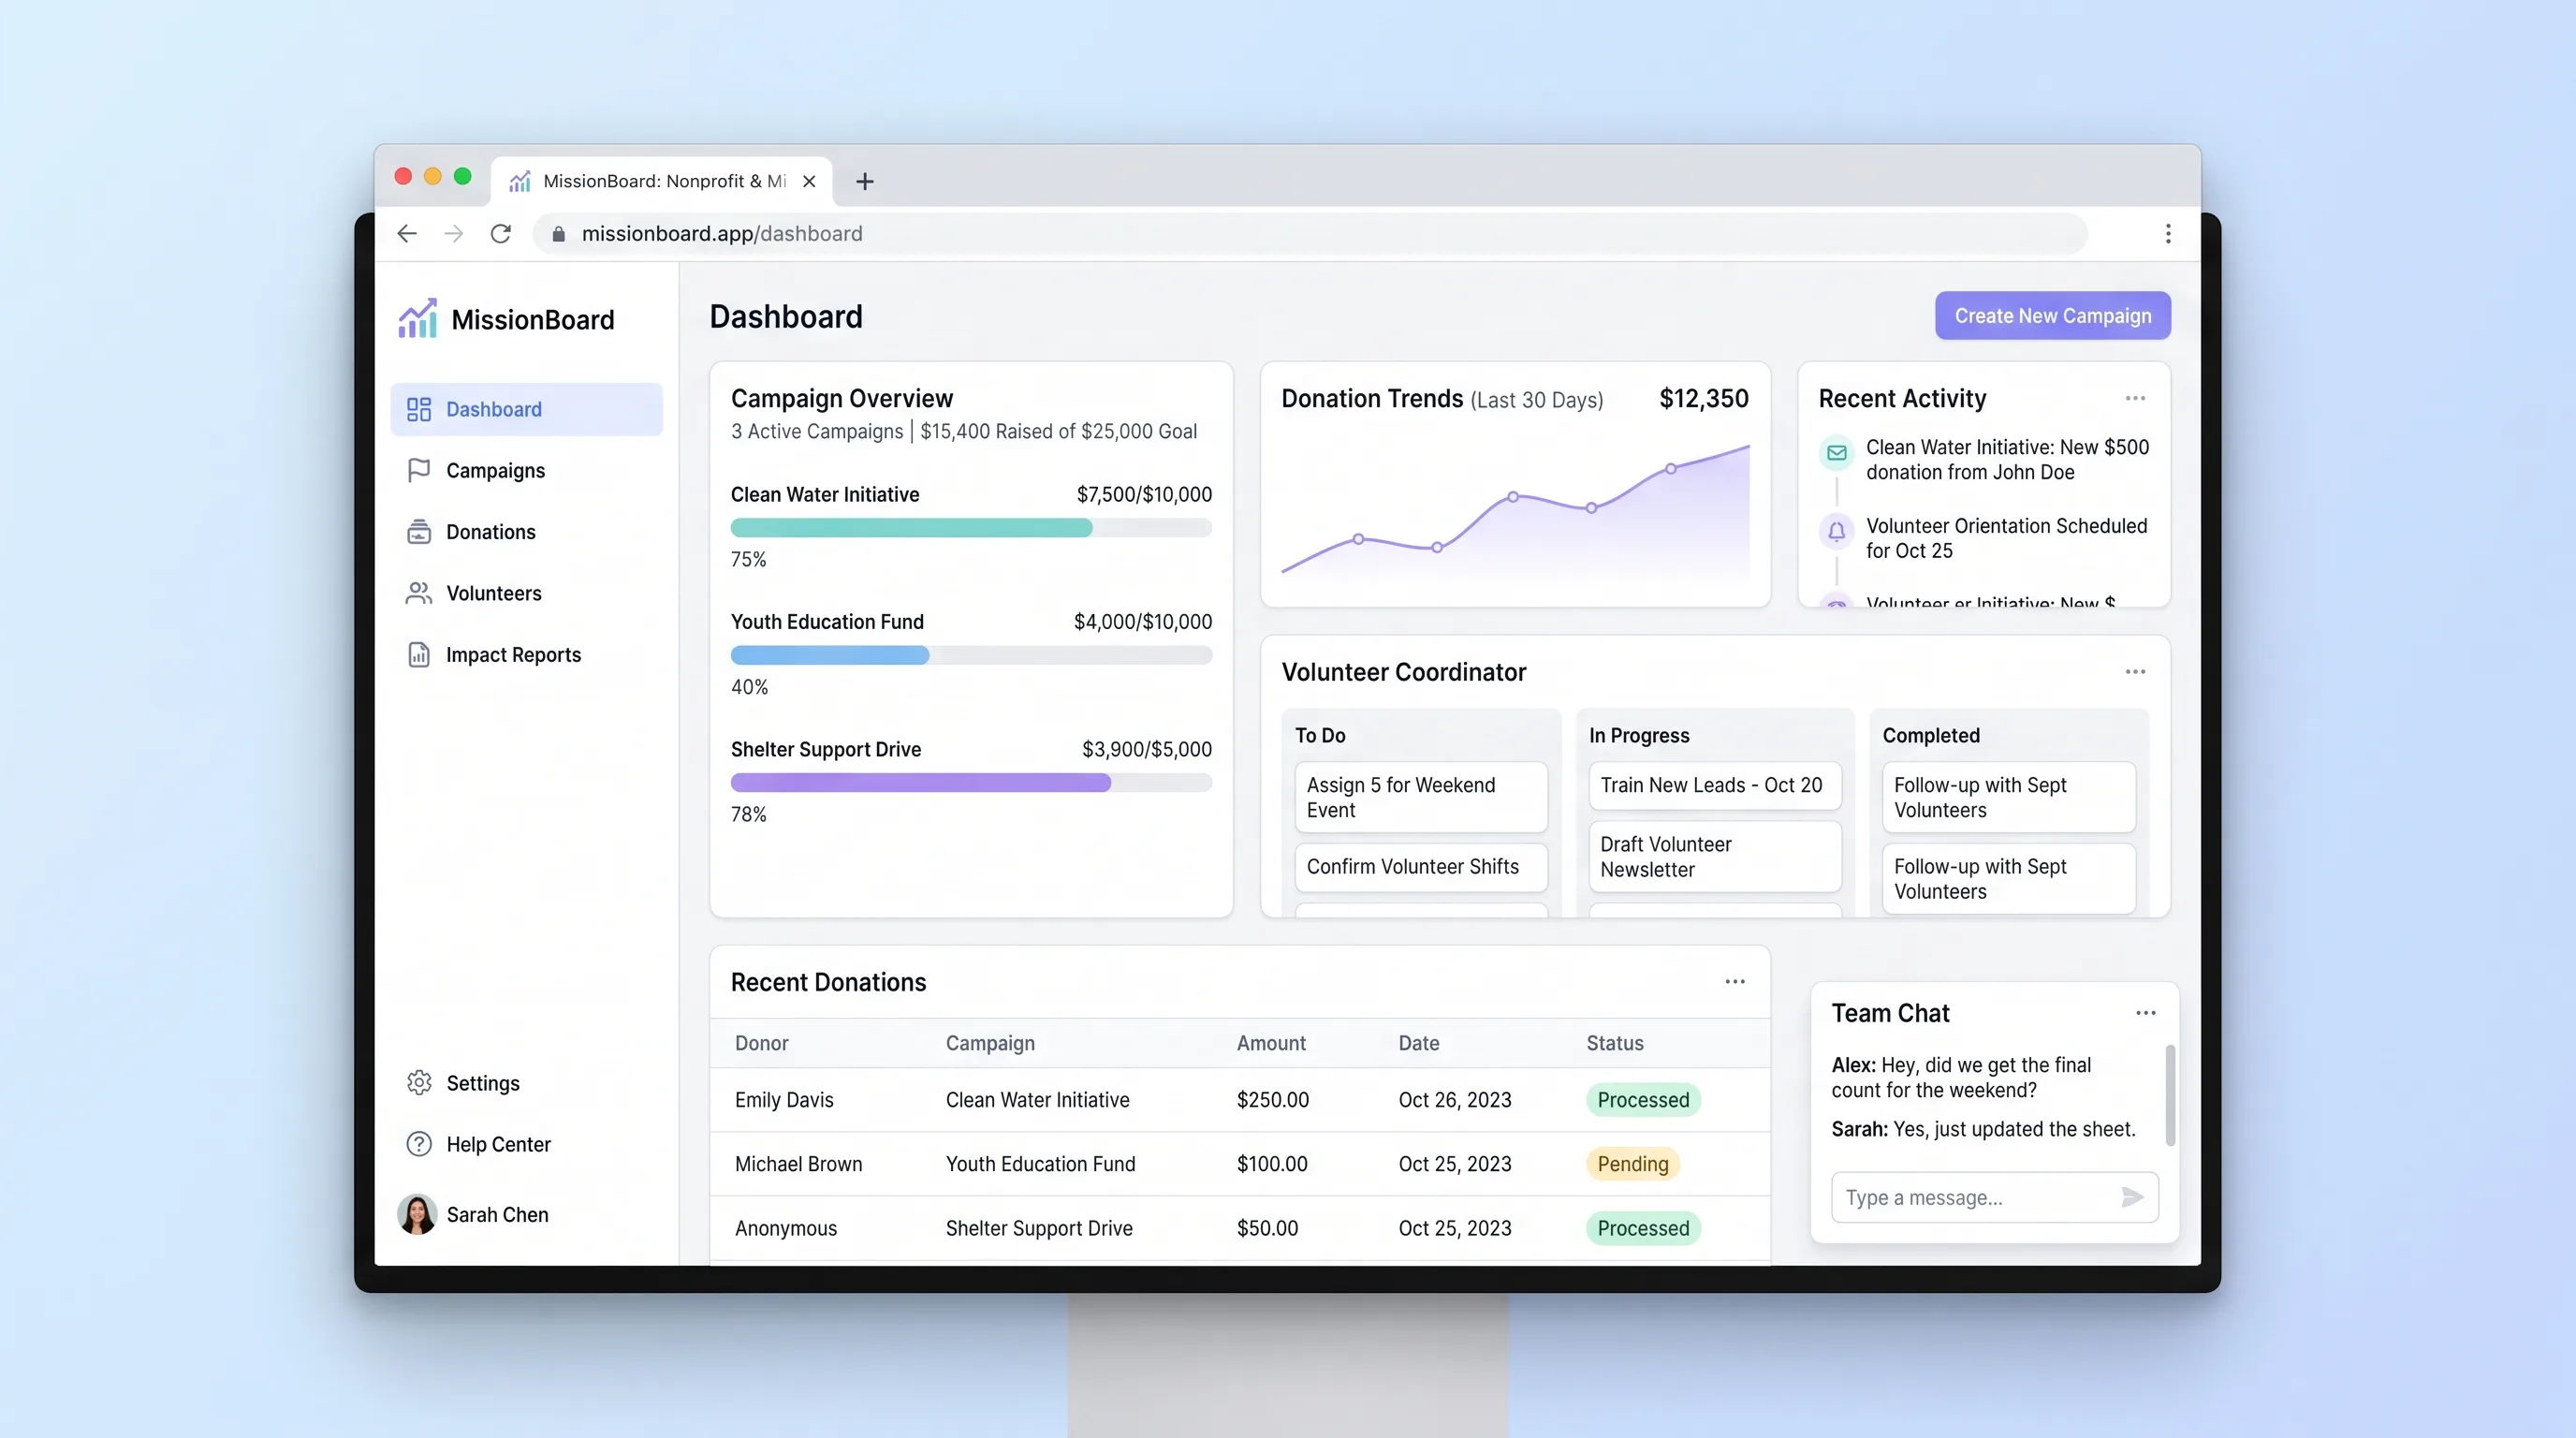
A shared operations hub for small nonprofits and ministry teams to coordinate campaigns, reconcile contributions and volunteer work, and report outcomes.