Build this if
You ship to indie devs and small teams who already run CI on GitHub Actions or GitLab CI and want a fast, opinionated flakiness dashboard without configuring a full observability stack.
A focused CI/CD pipeline health monitor and flaky test tracker that ingests build events, ranks the top three flakiest tests per repo in under sixty seconds, and surfaces branch-level failure trends for indie developers and small.
Decision snapshot
You ship to indie devs and small teams who already run CI on GitHub Actions or GitLab CI and want a fast, opinionated flakiness dashboard without configuring a full observability stack.
Your buyers expect enterprise-grade compliance, on-prem deployment, or deep integrations beyond GitHub Actions and GitLab CI in the first release.
Ship a closed beta to twenty indie devs, ingest their public repo webhooks, and confirm that at least twelve return within seven days to view the top-three flaky tests view for their main repo.
Problem and target customer
Engineering teams lose hours each week chasing intermittent CI failures spread across GitHub Actions, GitLab CI, and other runners, with no single view of which tests are flaky, which branches are degrading, or which repos are regressing.
Indie developers and small engineering teams running multiple repos on GitHub Actions or GitLab CI who need a lightweight observability layer without adopting a full enterprise DevOps platform.
Self-serve monthly subscription with a free tier for one repo and a paid workspace tier for unlimited repos, longer history retention, and team seats.
Editorial note
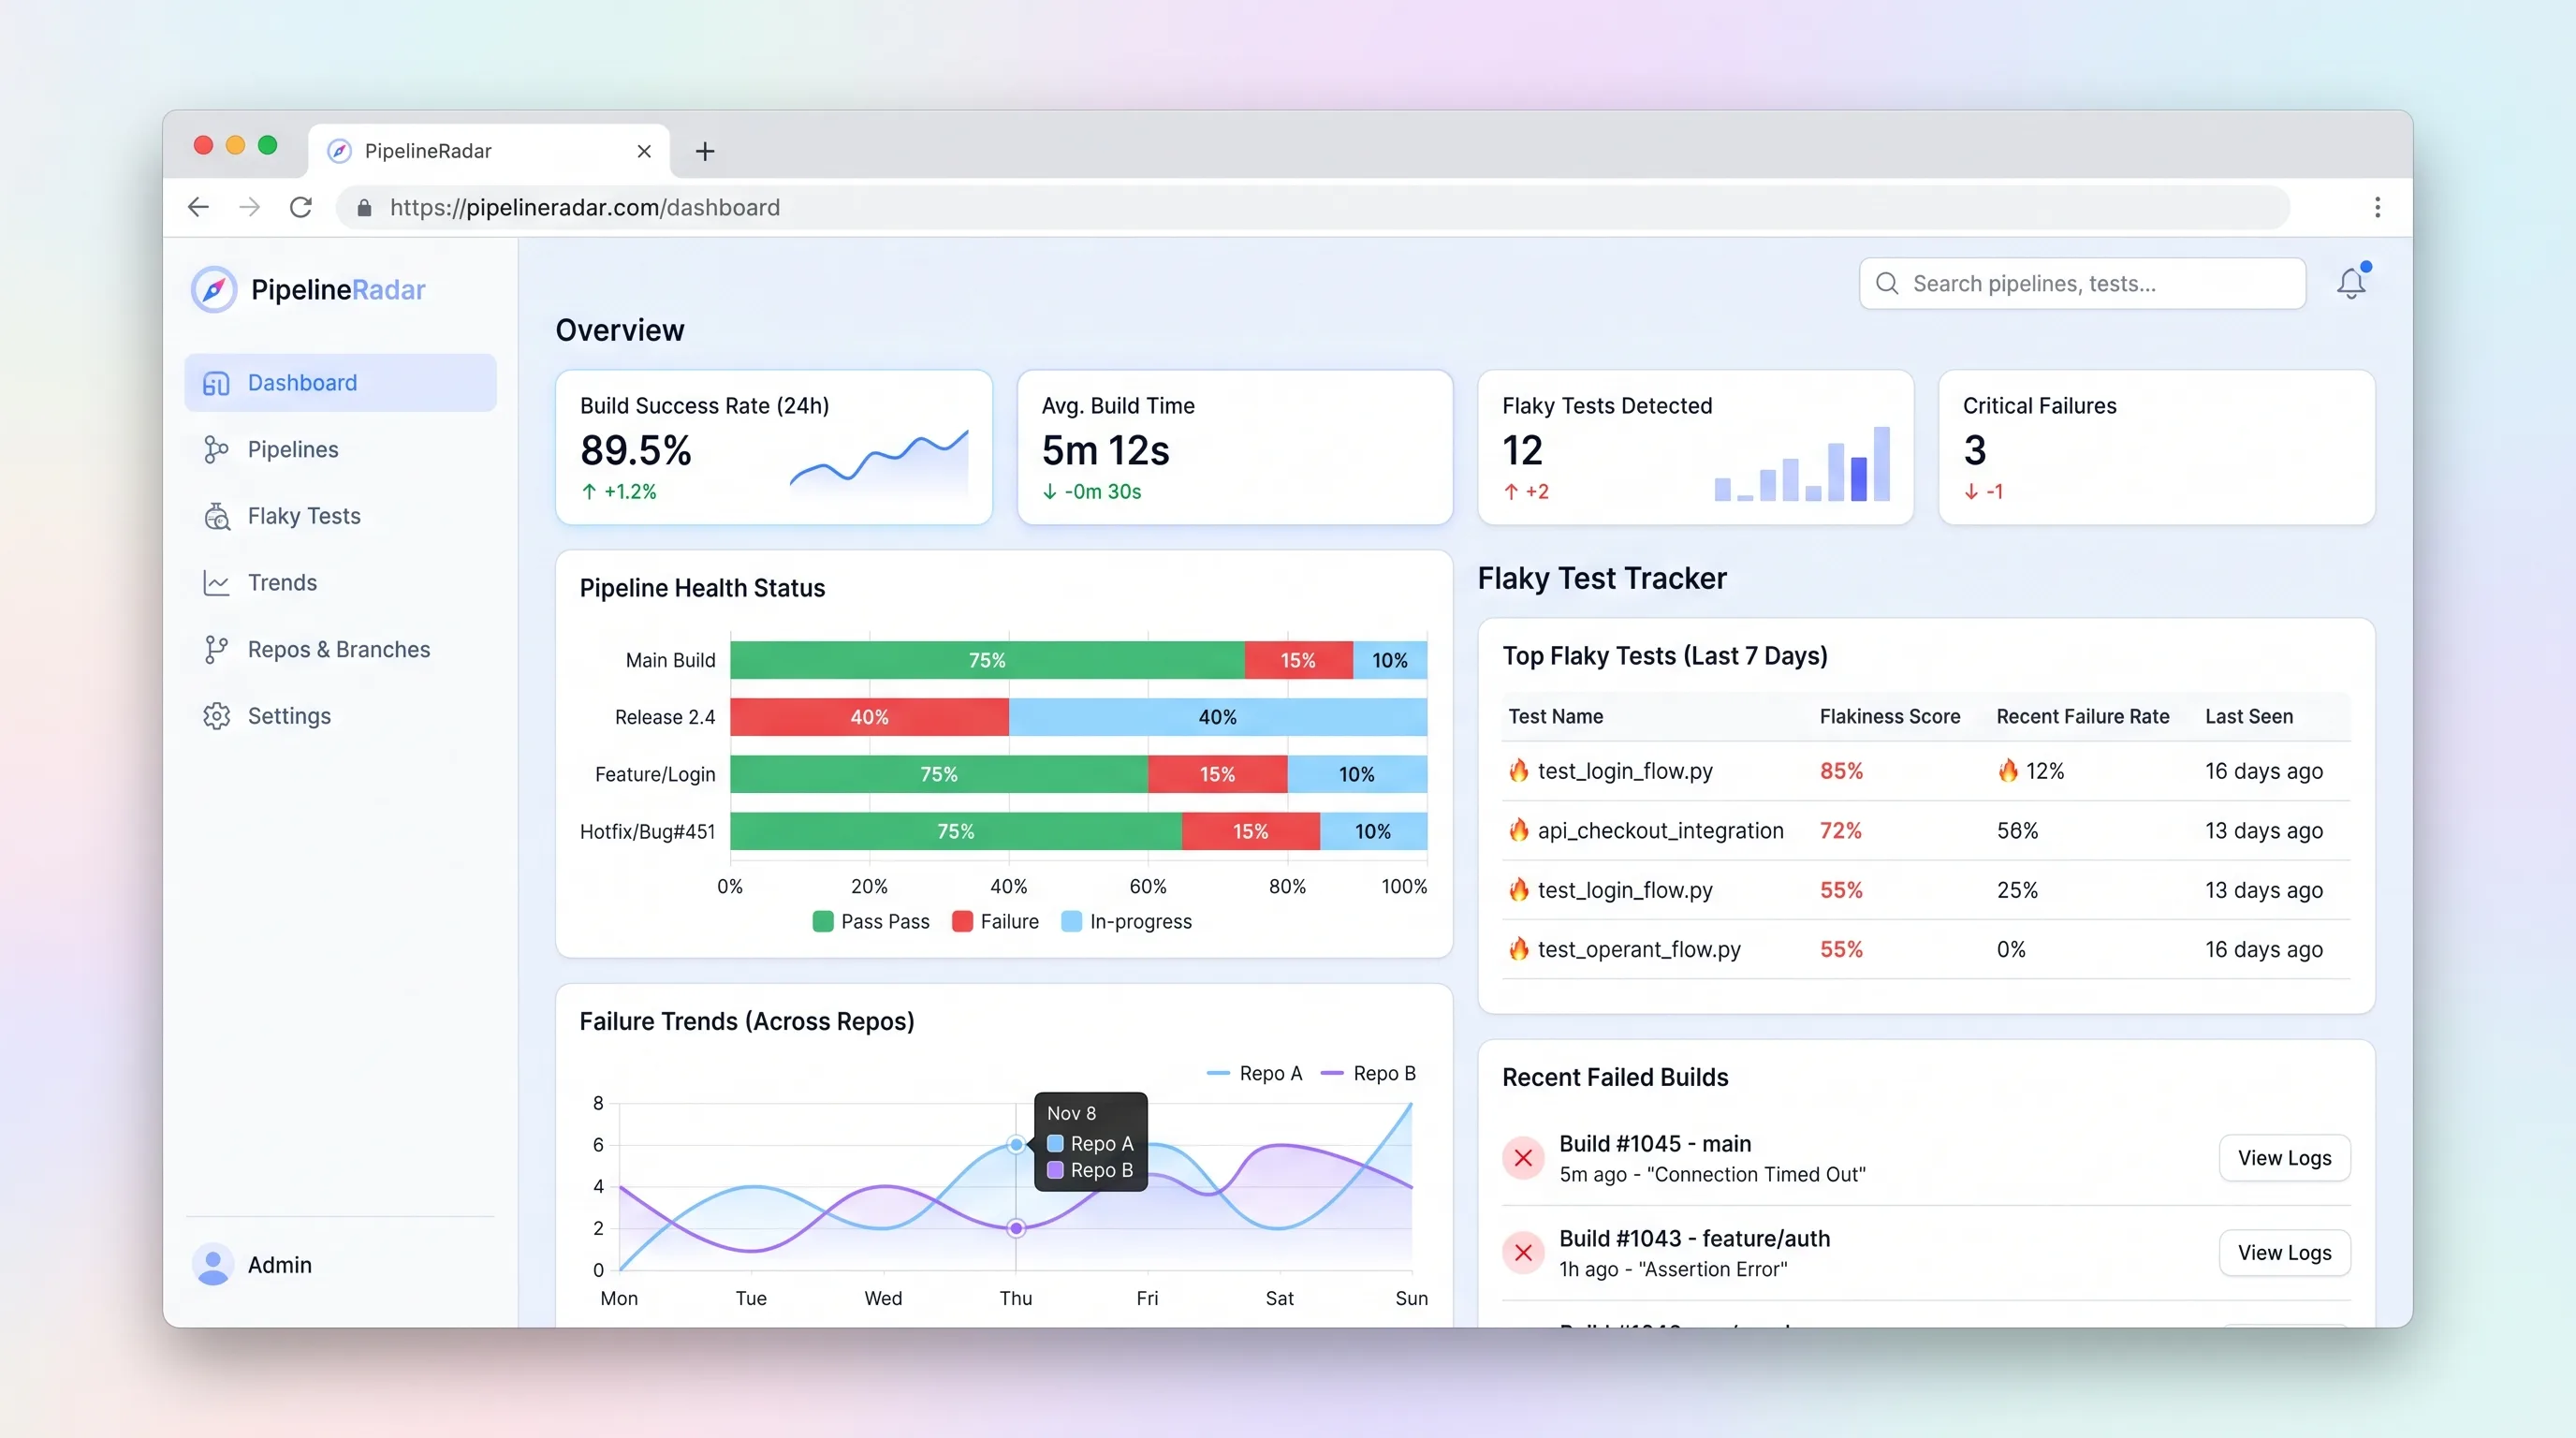
PipelineRadar turns scattered CI signals into a single repo health view that indie devs can scan in under a minute.
The top-three flaky tests leaderboard is the anchor feature: it answers the question every developer asks after a red build.
Branch trend charts make it obvious whether a repo is getting healthier or drifting toward more failures over time.
Choose your next step
Evaluate the operating tradeoffs quickly, or inspect how to build the MVP.
Compare the three operating paths at the default workload before opening the full calculator.
See cost preview Build this ideaInspect the build blueprintReview MVP scope, workflow, states, data rules, architecture, and acceptance criteria.
Open blueprintEvaluation preview
Directional infrastructure estimates for the current 1,200 tracked work items assumption. Open the full calculator when you are ready to change it.
Managed app hosting, database, backups, and basic observability for the developer-ops workflow.
Lowest operating effortOne small VPS running the app, database, media volume, and backup job.
Lowest baseline costSeparate app, data, storage, and worker capacity for cleaner operations.
Most separation and controlBuild blueprint
Product goal
MVP scope
UX and user flow
Workspace home with connected repos
Repo detail with status pills and trend chart
Flaky tests leaderboard
Branch detail with failure history
Workspace settings for repos and retention
Core entity outline
Workspace
Repo
Build
Test
FlakyScore
Architecture and data flow
Lovable dashboard
Railway webhook receiver
Supabase Postgres
Resend digest sender
GitHub and GitLab OAuth apps
Deliverables and acceptance
Recommended stack
Lovable for the dashboard UI and workspace pages
Supabase Postgres for builds, tests, branches, and workspaces
Railway for the webhook receiver and scheduled digest jobs
Resend for transactional digest emails
GitHub and GitLab OAuth for repo authorization
Lovable ships the terminal-inspired dashboard quickly, Supabase Postgres handles the relational build and test history, Railway runs the webhook receiver close to the source, Resend delivers weekly digests, and OAuth keeps repo authorization scoped to the minimum permissions needed.
Copy the build prompt, model the operating cost, and choose where to deploy.
Execution
Once the blueprint is clear, use the prompt, cost model, and deployment options to start building.
Build prompt
lovable
Build prompt
Open the prompt pack whenever you are ready to take this blueprint into your builder.
Build prompt ready
Copy the prompt into your builder, then use the cost model below to choose how you want to run it.
Use the cost model to choose a deployment path that matches the build plan.
Cost calculator
A technical run-cost estimate for the first production version. Team, acquisition, payment fees, and business COGS are excluded.
$13-$33 per 600 tracked work items
Low and high values allow for usage variance and plan headroom.
Managed app hosting, database, backups, and basic observability for the developer-ops workflow.
50K tracked work items included, then $8-$20 per 100K tracked work itemsThe estimate combines the selected infrastructure path, required operating modules, selected optional modules, and usage above included monthly allowances. Taxes and regional uplifts are excluded.
Deployment options
Choose based on operating preference, not only the headline price.
Fast Docker deployment for the app, database, worker, and preview workflow without managing a VPS.
Usage billing needs active monitoring as traffic and jobs grow.
Run the app, worker, and database on one small Vultr VPS with Docker Compose and explicit backups.
You own patching, backups, monitoring, and incident response.
Separate application, worker, data, storage, and backup responsibilities as the workload grows.
You own server setup, patching, backups, and operational monitoring.
Start building
Use Lovable to assemble the workspace, repo list, status pills, flaky leaderboard, and branch trend chart with a terminal-inspired dark theme and GitHub or GitLab OAuth.
Open Lovable 02AutomationWire webhook ingestion and digest delivery in MakeUse Make as bounded glue to forward GitHub Actions and GitLab CI webhook payloads into the Railway receiver, normalize them, and trigger weekly digest emails through Resend.
Open Make 03DeployRun the webhook receiver and digest scheduler on RailwayDeploy the Railway service that validates incoming CI webhooks, writes build and test records into Supabase Postgres, and schedules the weekly flakiness digest job.
Open RailwayKeep exploring
Internal ToolDeveloper & IT Operations
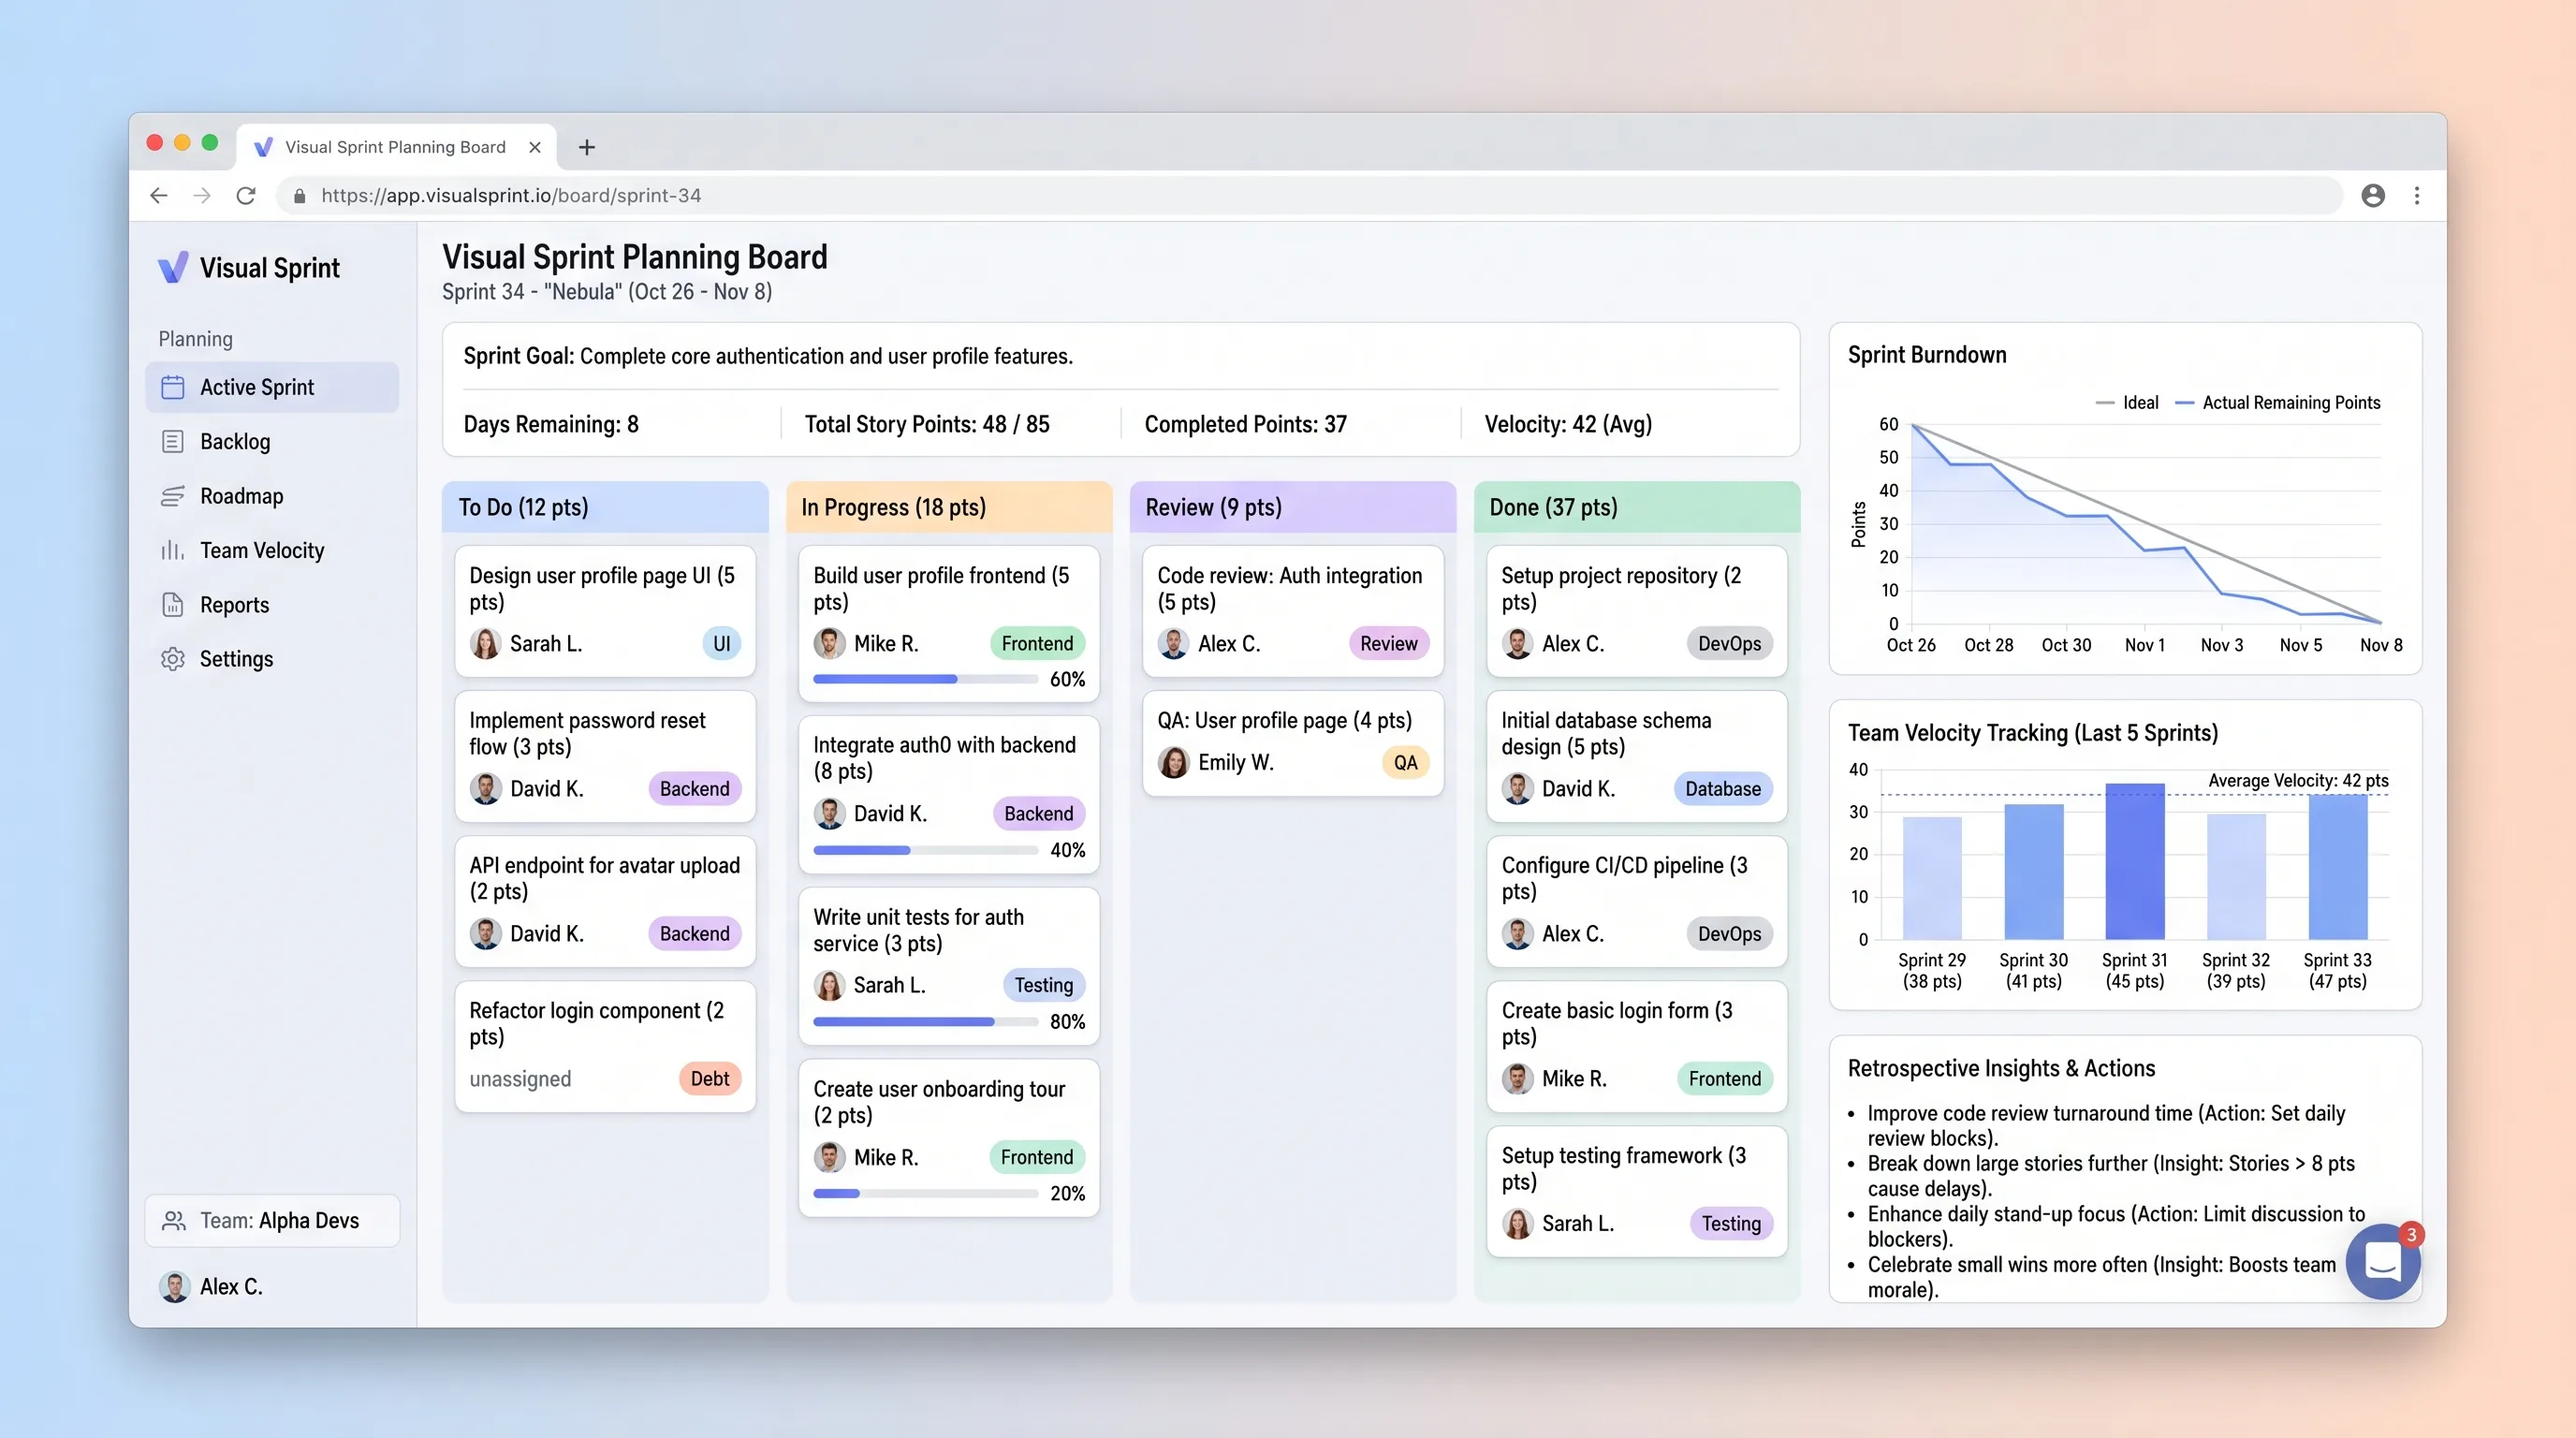
A sprint board that helps small development teams commit work against recent capacity, track story-point movement, and carry evidence into retrospectives.
Internal ToolDeveloper & IT Operations
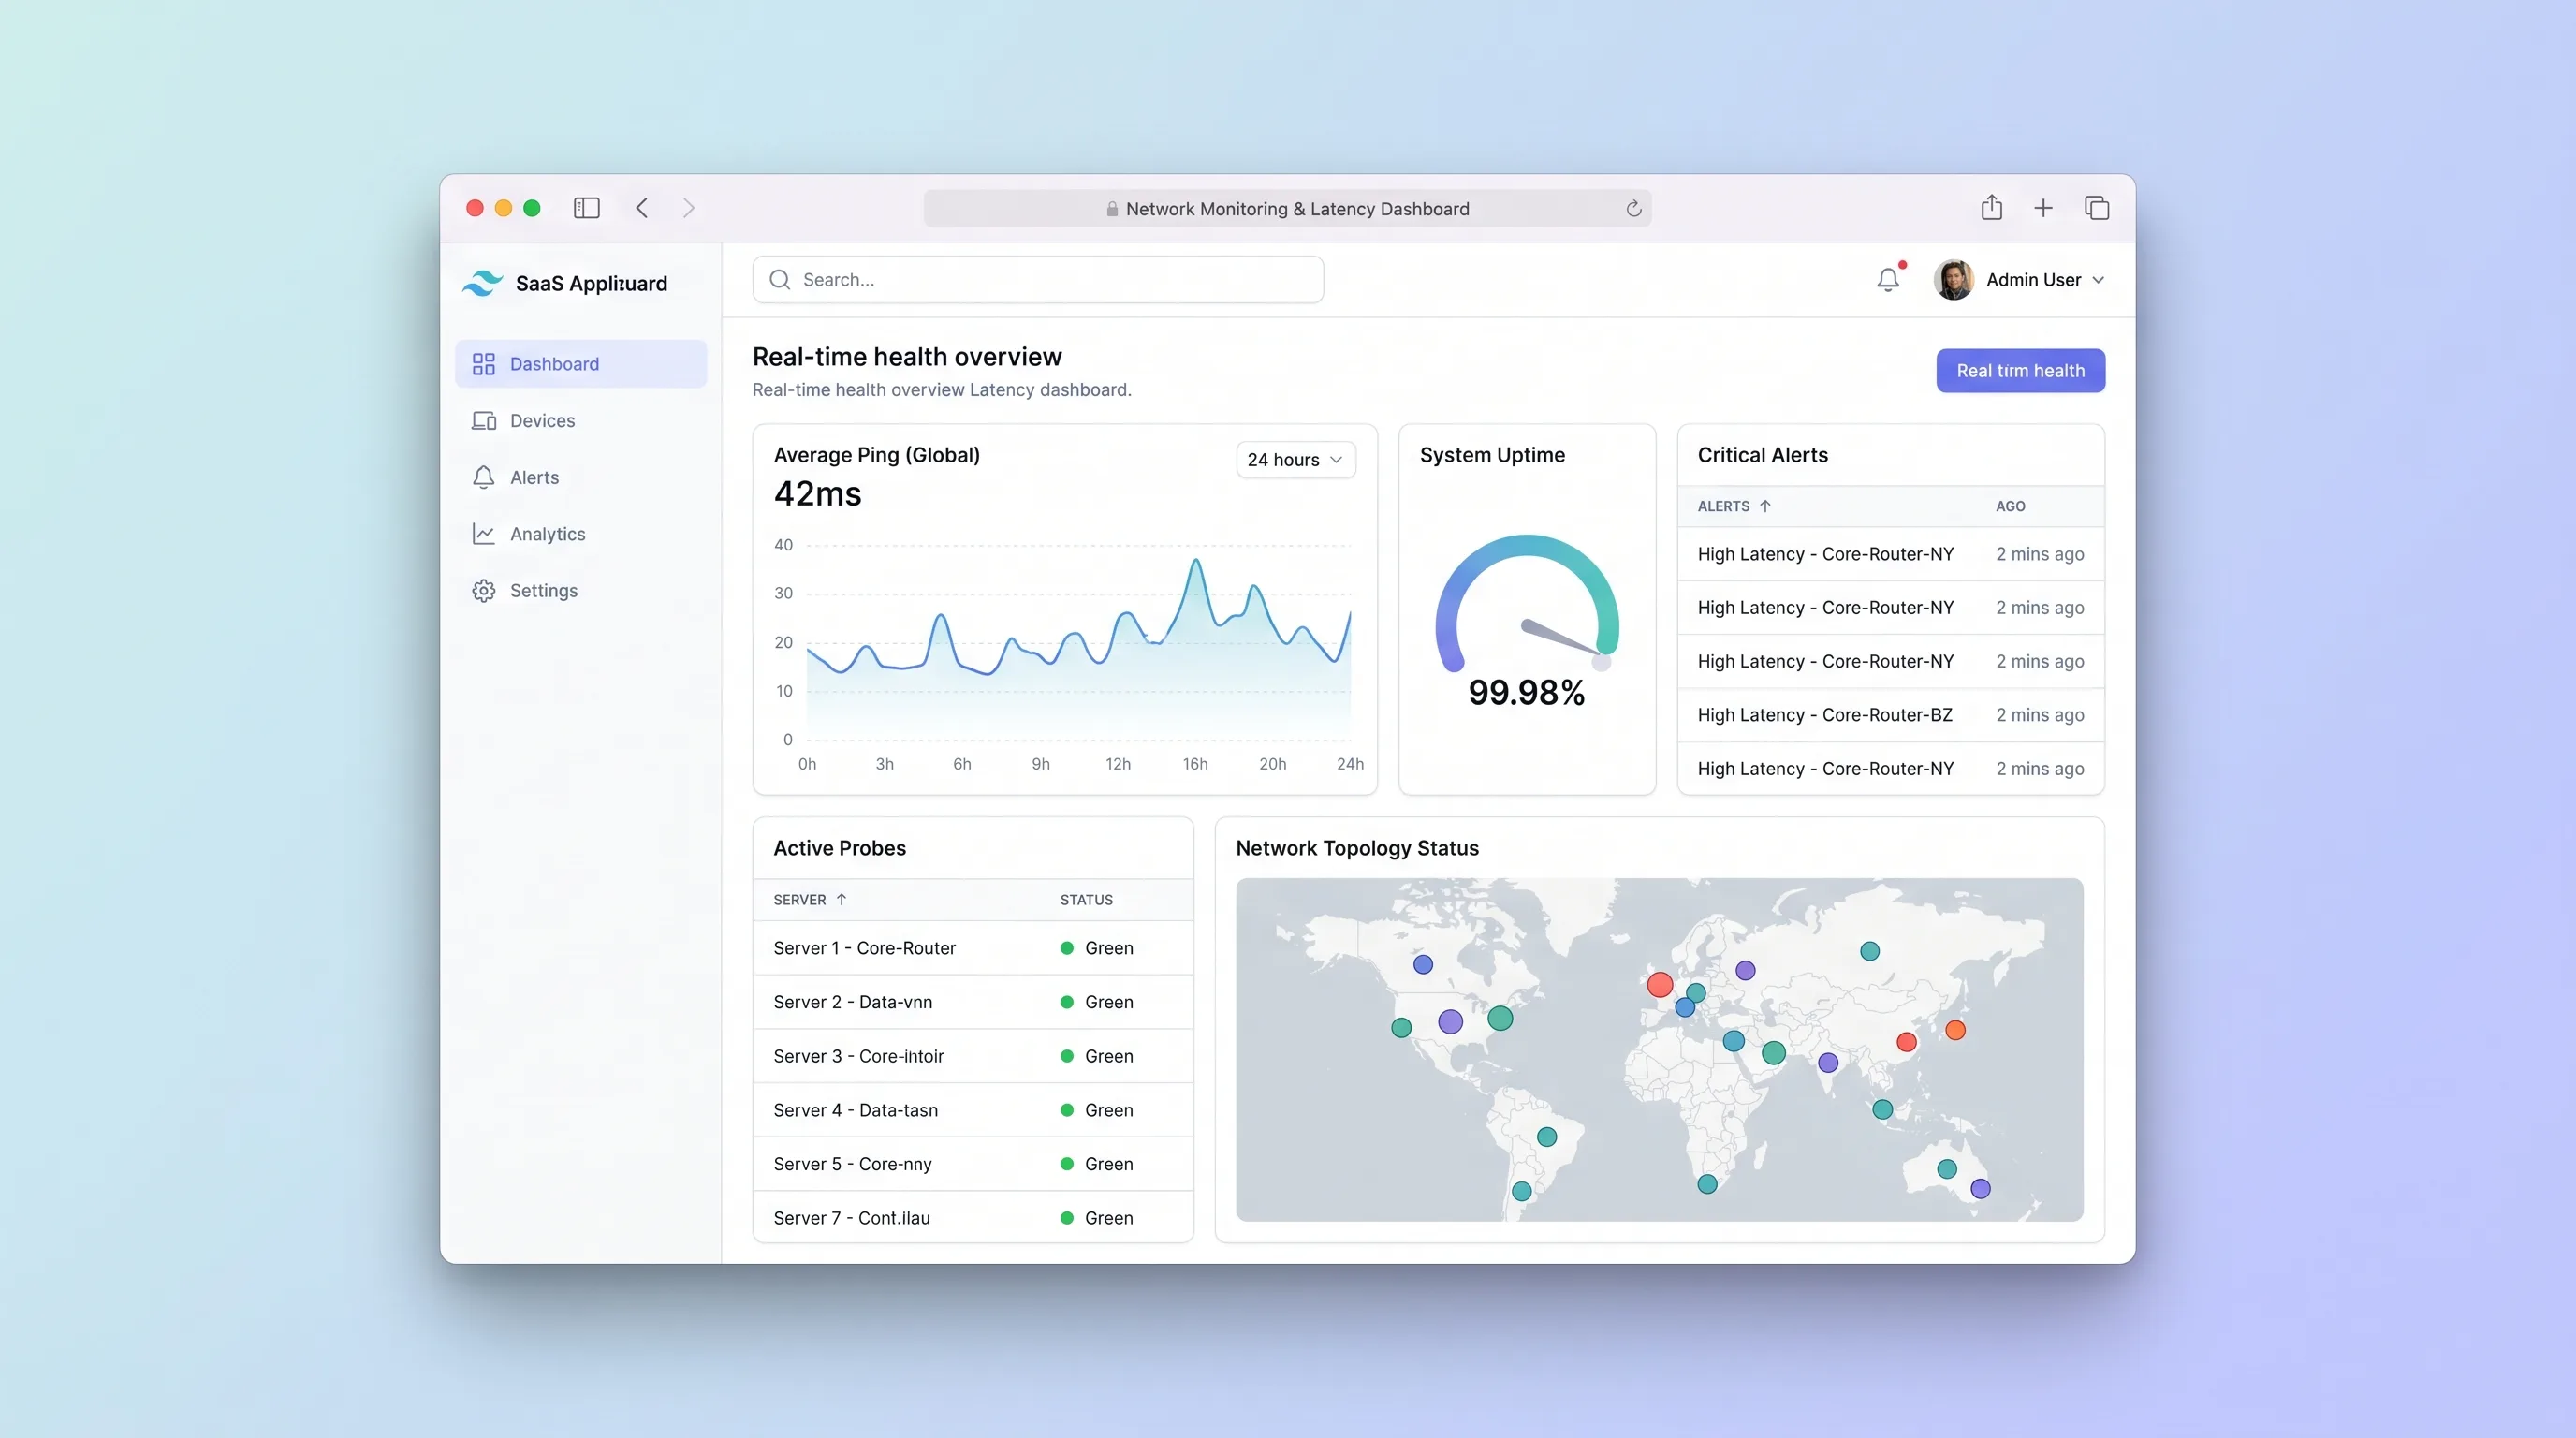
A focused uptime monitor for small IT teams that schedules endpoint checks, separates transient failures from incidents, and preserves alert and latency history.
Internal ToolDeveloper & IT Operations
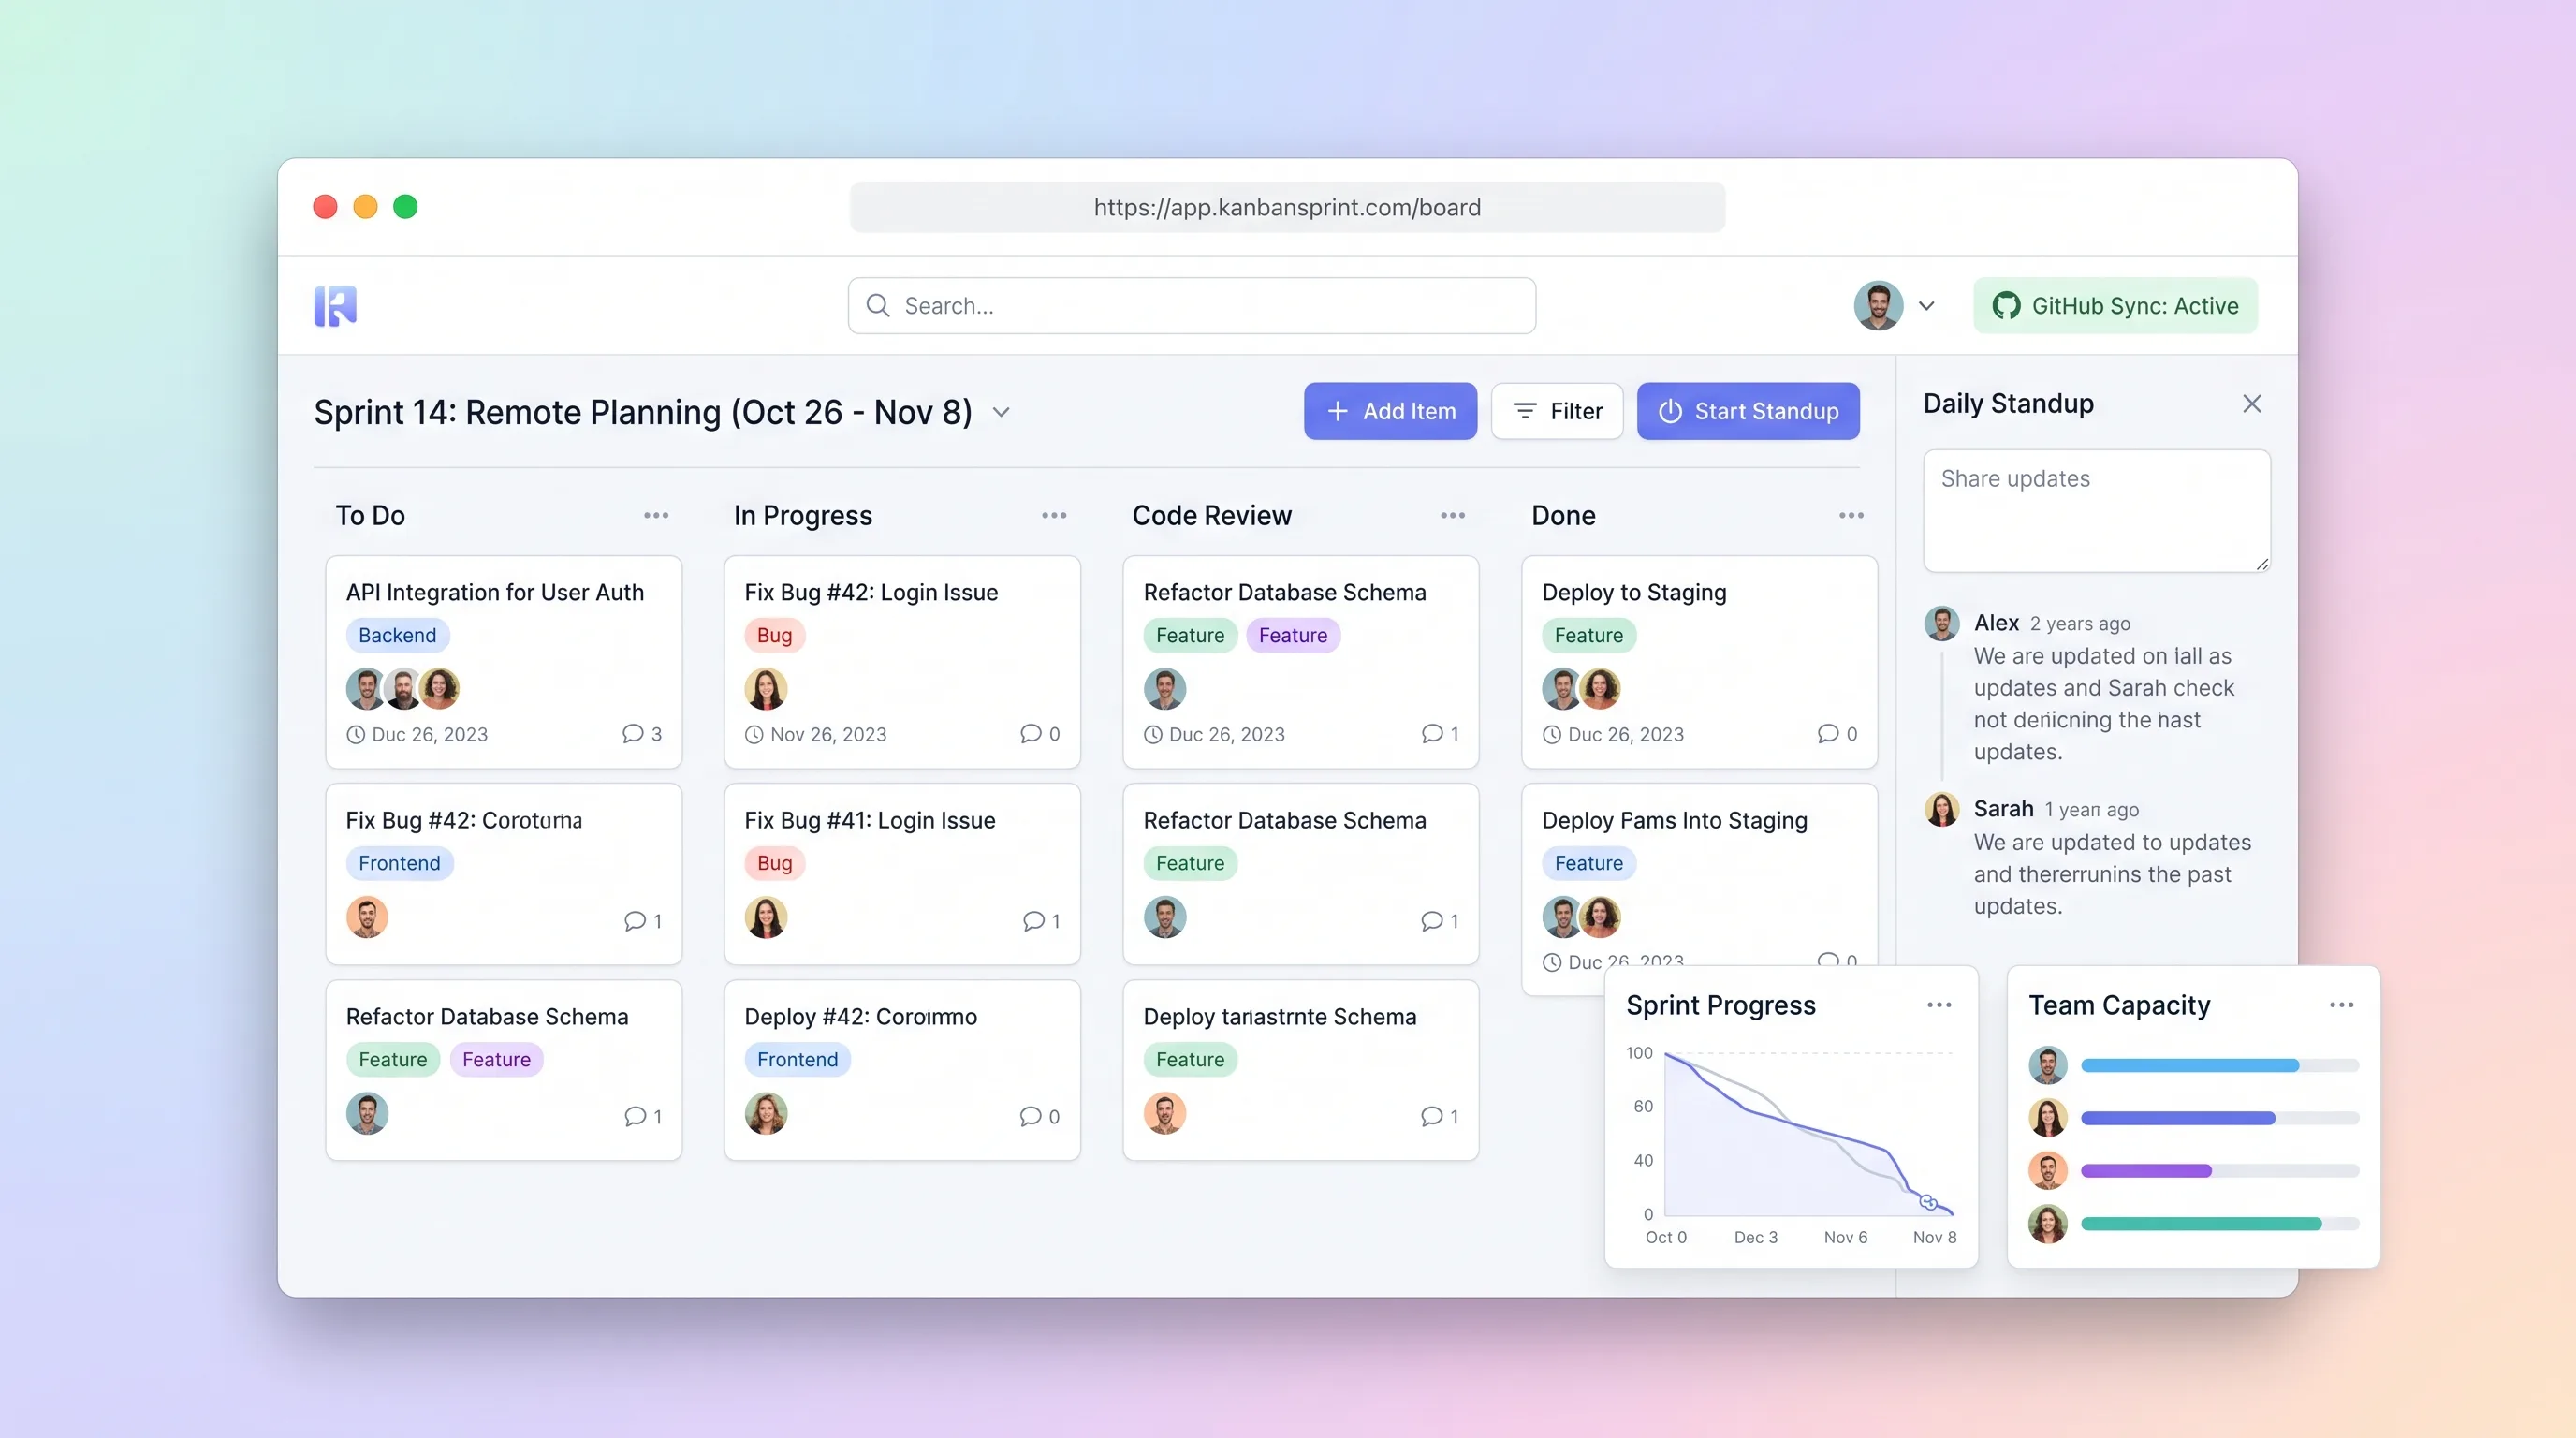
A compact planning workspace that keeps sprint commitments, GitHub issue state, board movement, daily blockers, and end-of-sprint carryover aligned.
Internal ToolDeveloper & IT Operations
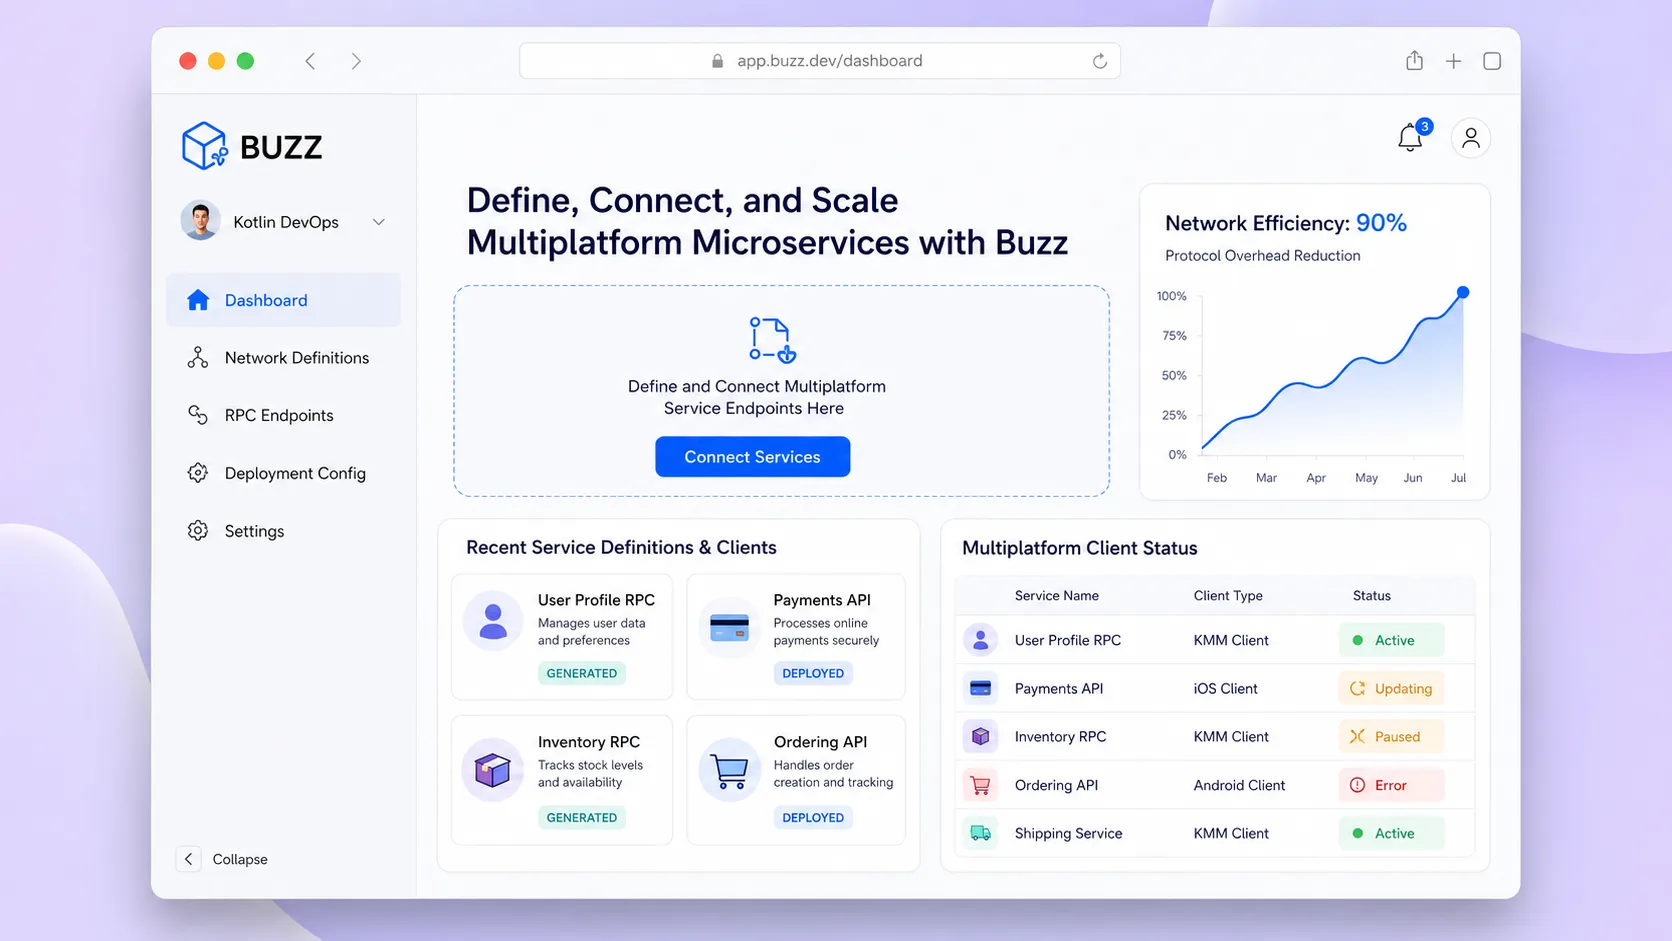
A self-hostable project workspace where humans and AI agents collaborate in signed rooms that unify conversation, code patches, workflow events, and approvals into one searchable, auditable event log.
Internal ToolDeveloper & IT Operations
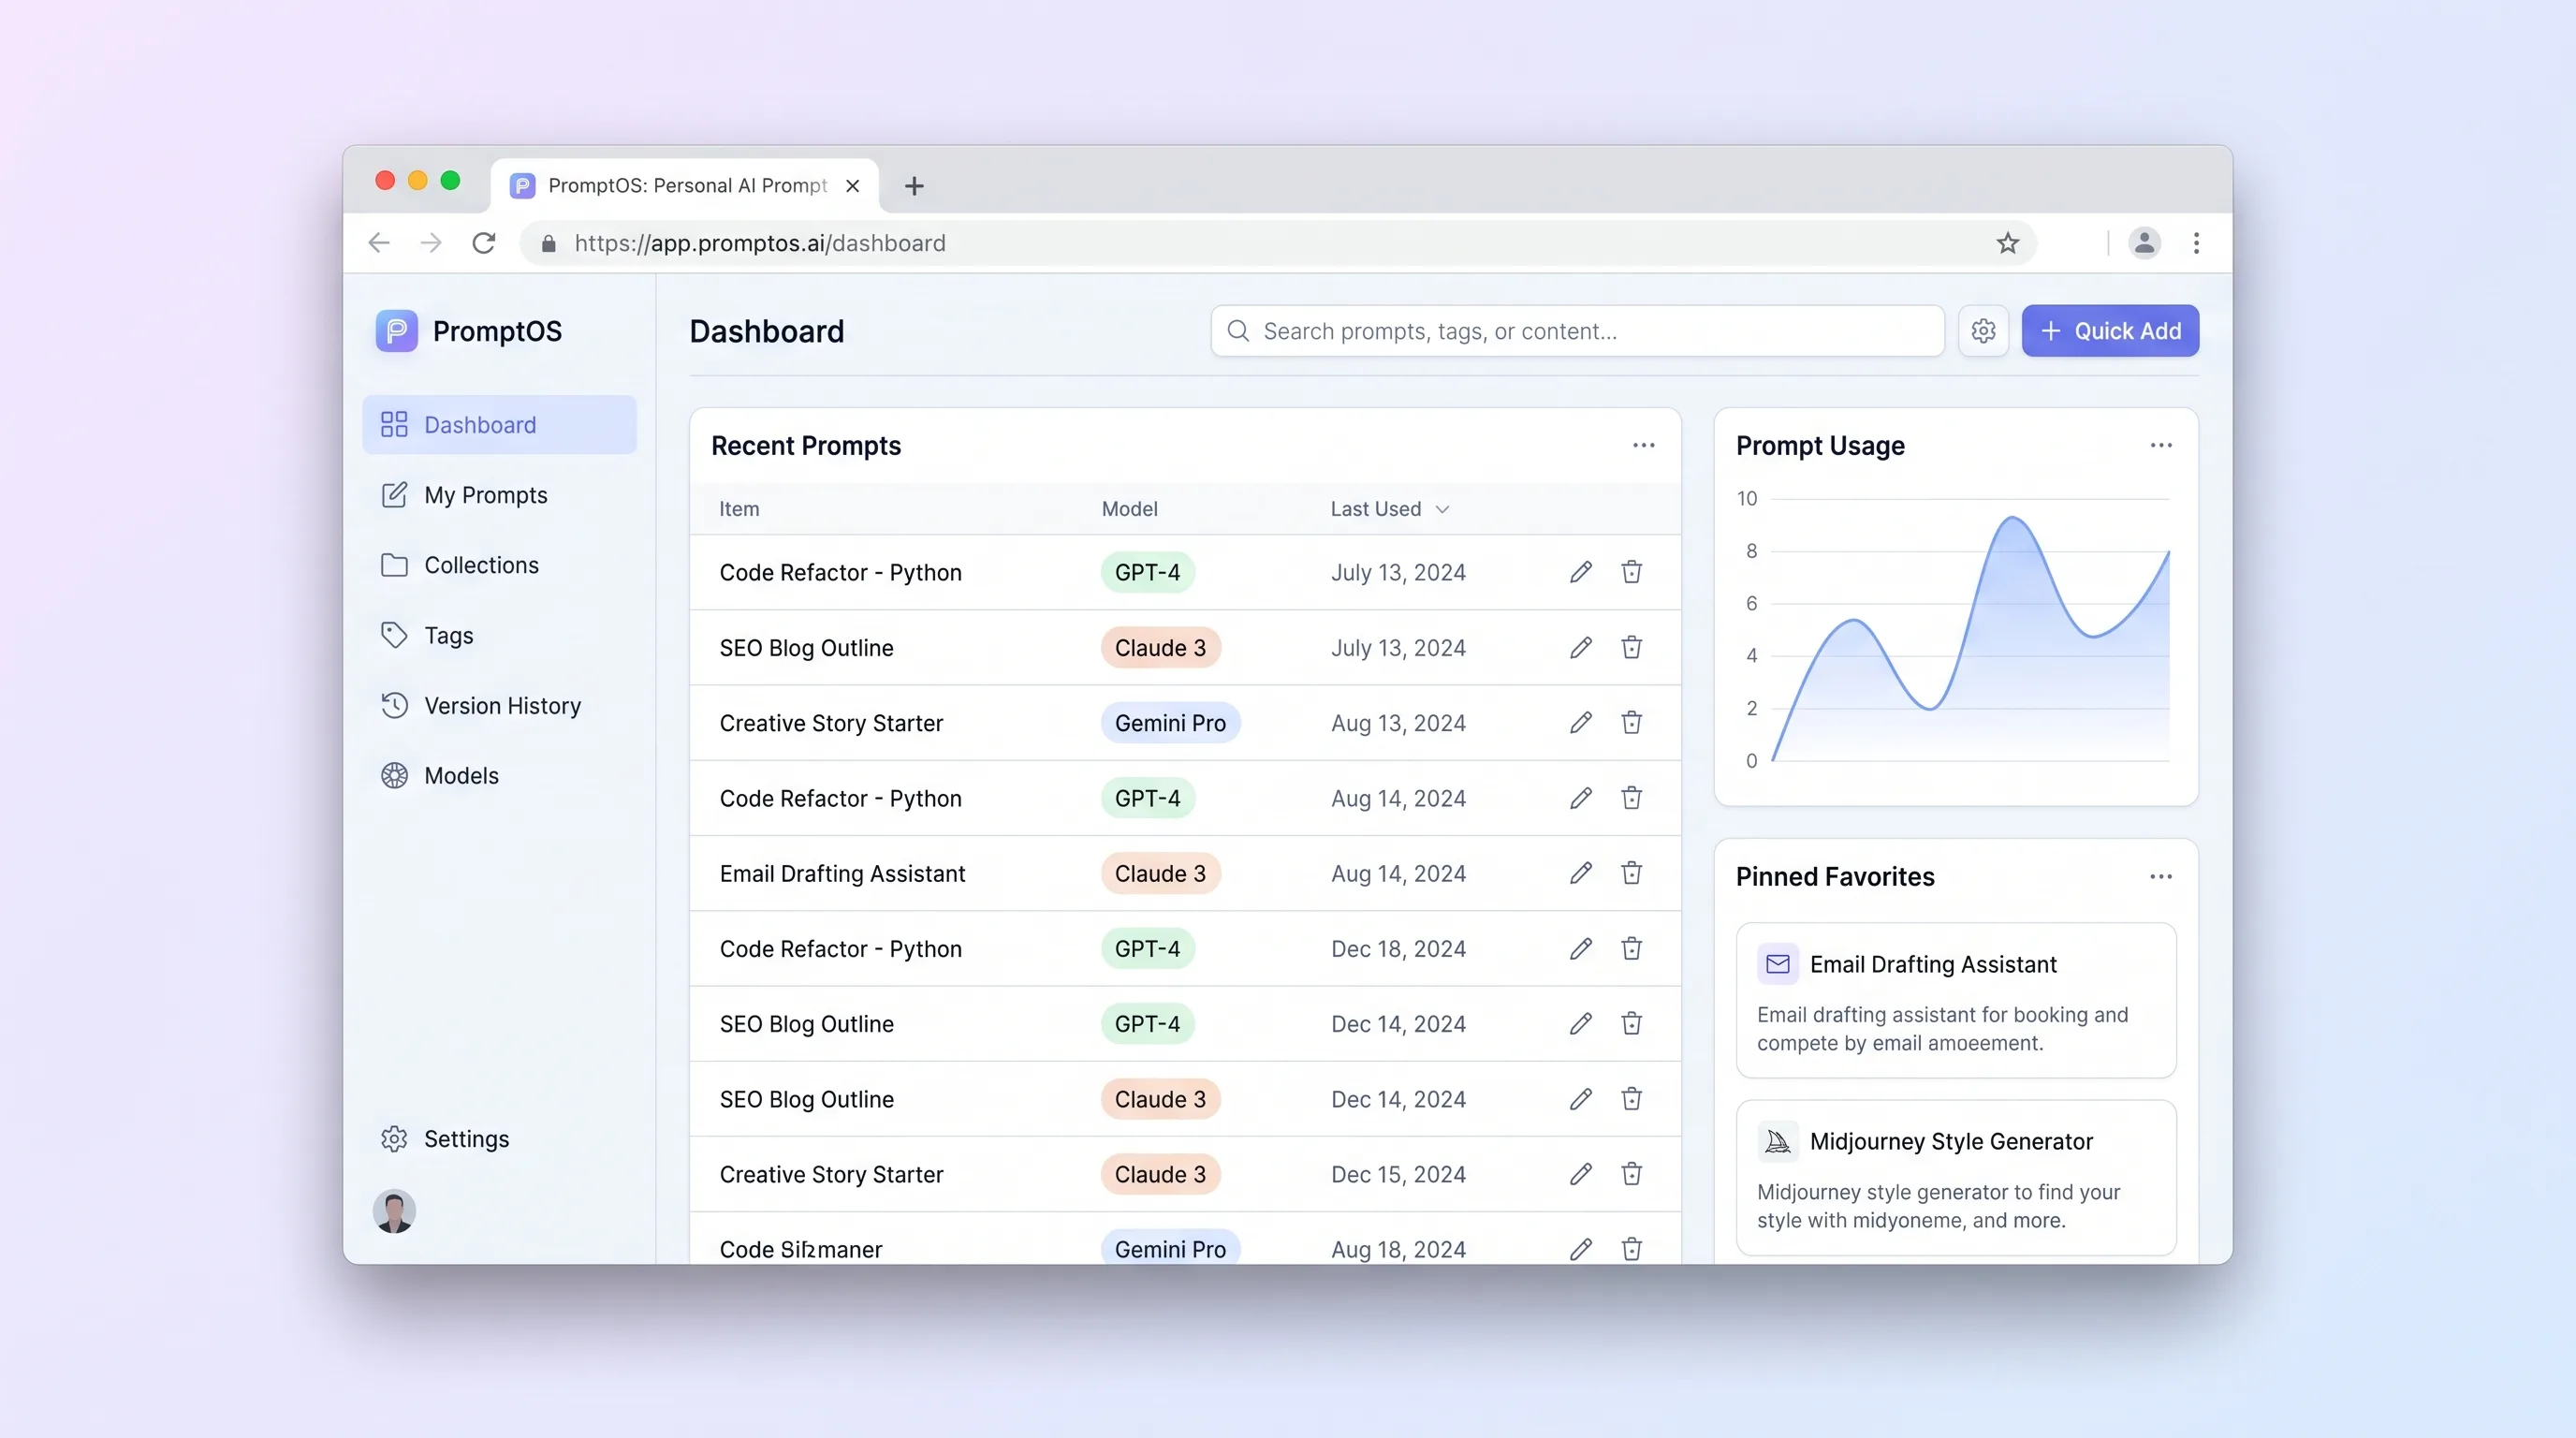
A private library for power users to save, tag, version, parameterize, and retrieve reusable prompts without depending on any model provider.
Internal ToolBusiness Operations
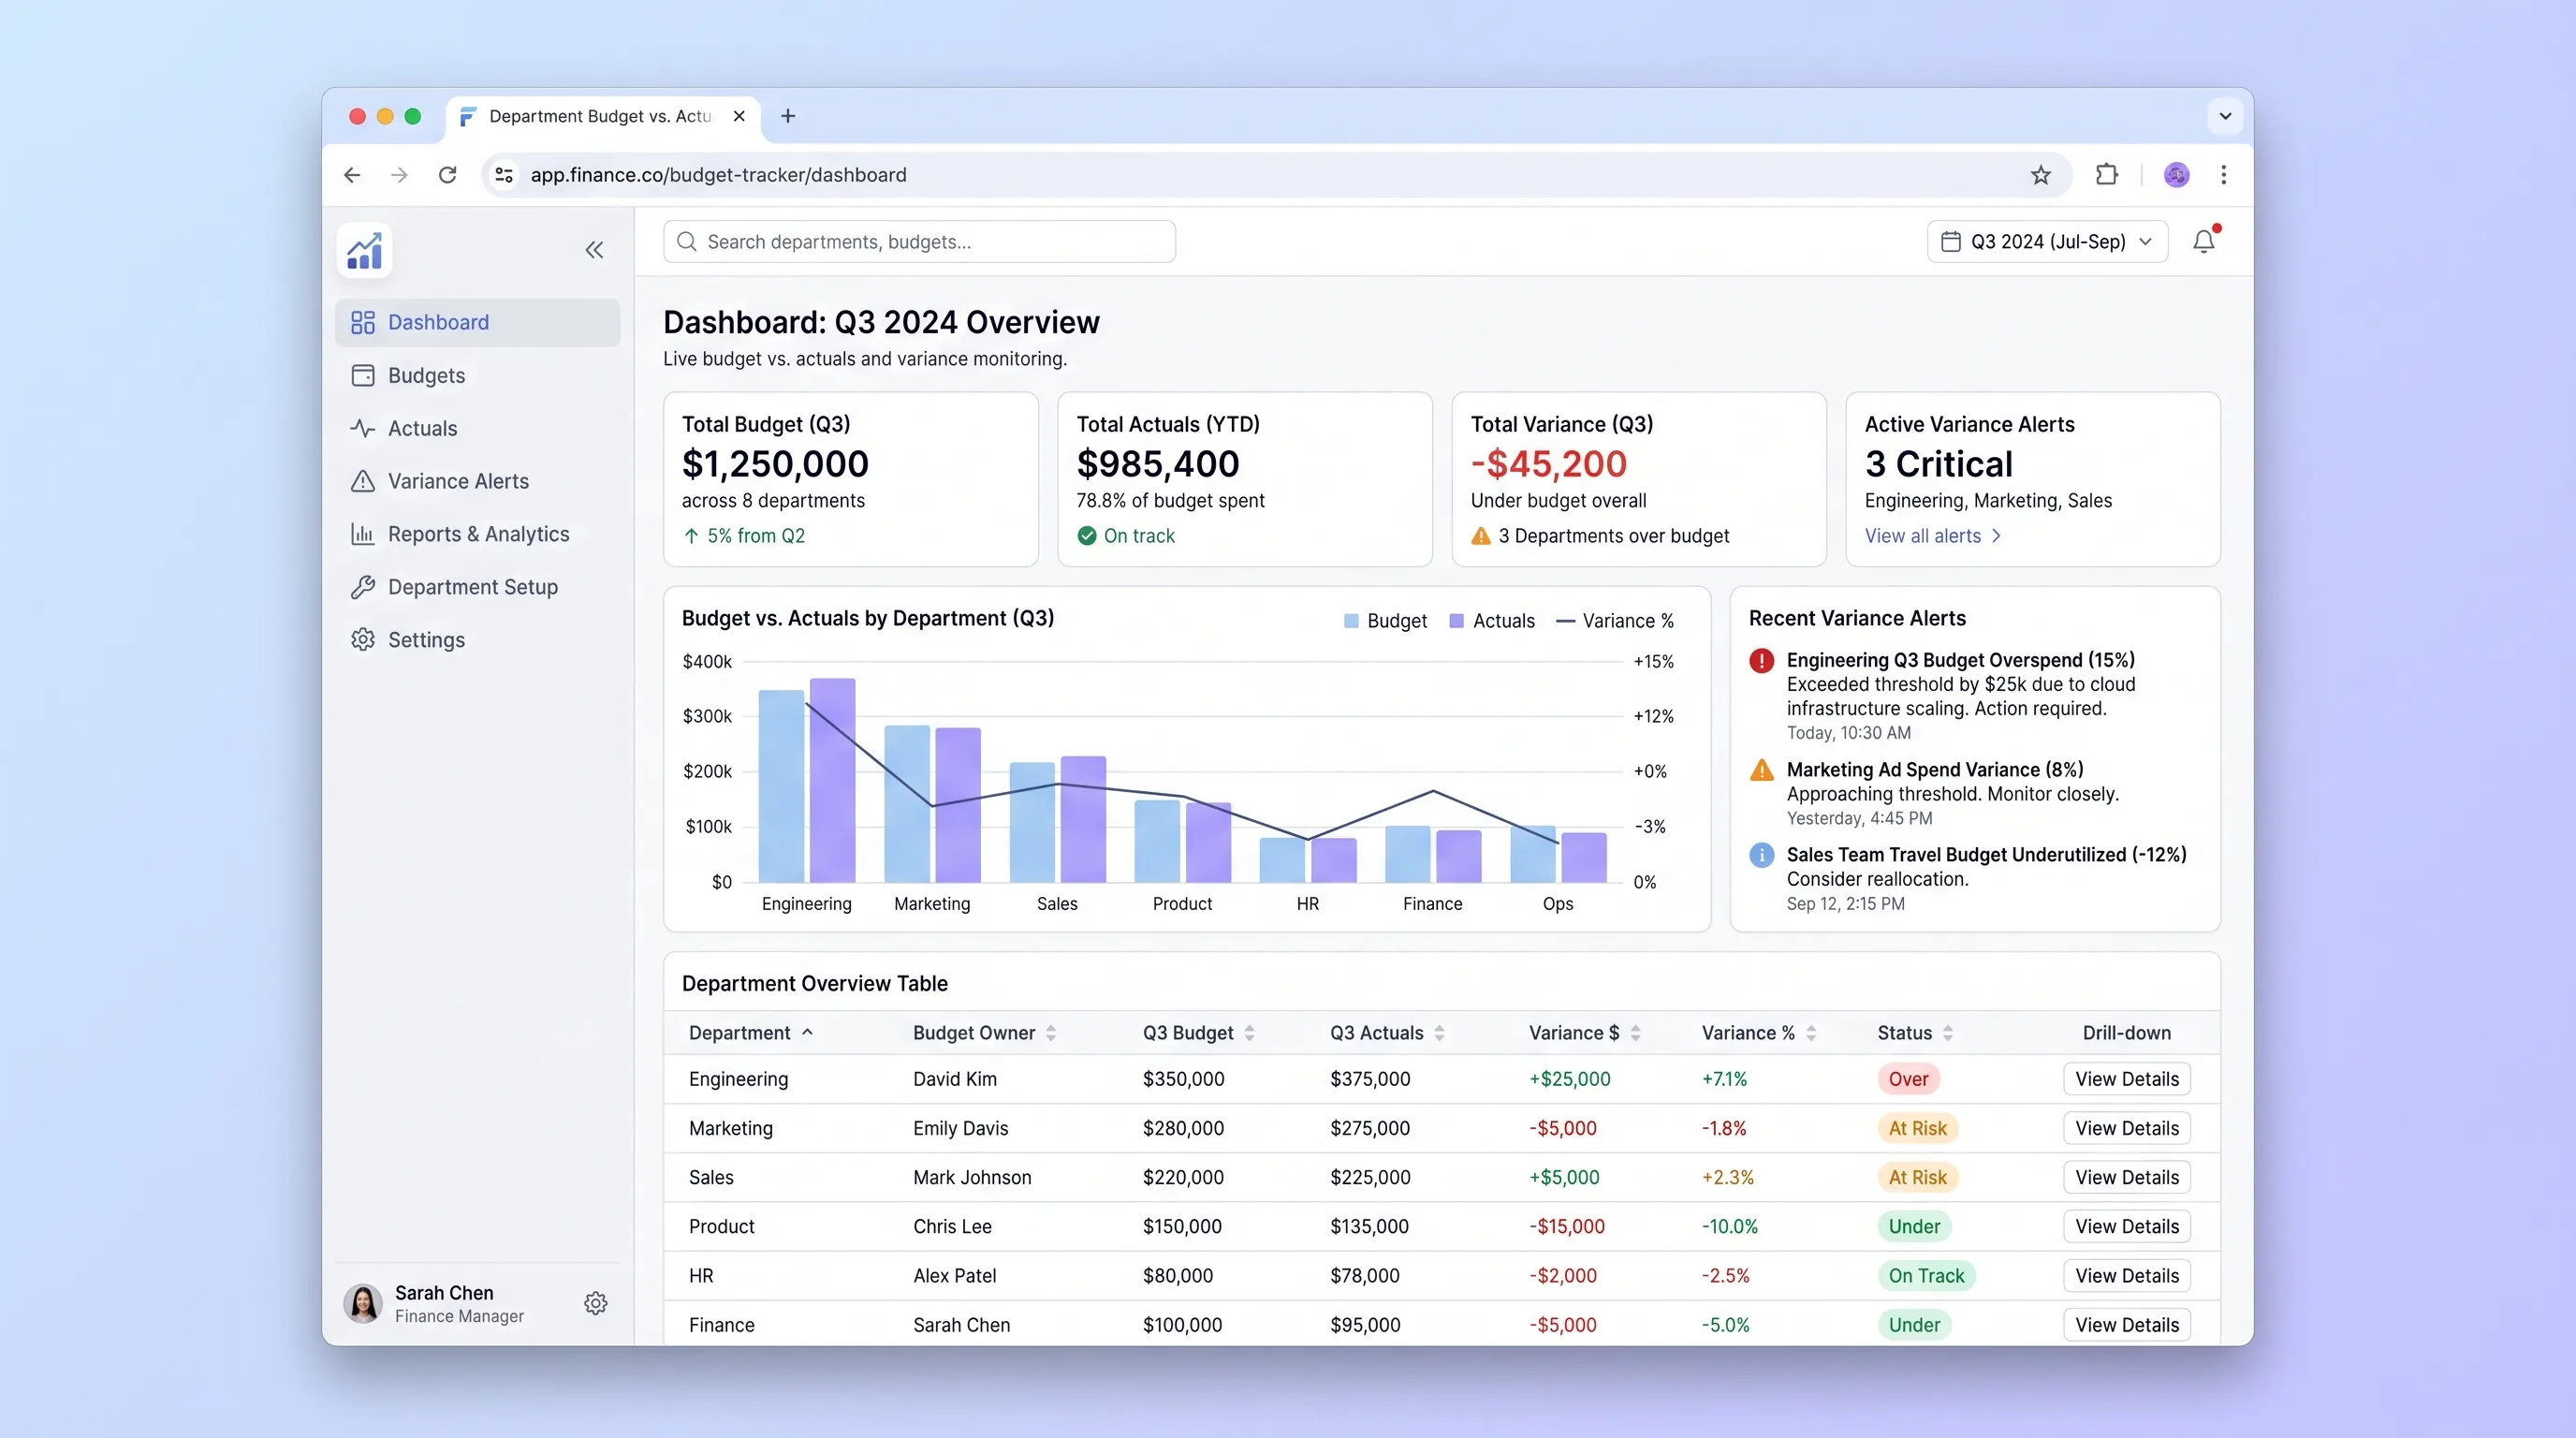
An internal tool that lets finance teams import annual budgets via CSV and gives department heads self-serve visibility into spend against budget with drill-down variance views and same-day threshold alerts.