Build this if
You can reach independent retail owners already exporting POS data who want a single dashboard instead of spreadsheets.
Analytics hub for independent retail store owners to import daily sales data, visualize best and worst performing days and products, flag low-stock SKUs, and set revenue goals.
Decision snapshot
You can reach independent retail owners already exporting POS data who want a single dashboard instead of spreadsheets.
Your target buyers expect deep multi-store enterprise reporting or real-time POS-native integration before trying a first version.
Recruit 10 shop owners to import one month of sales data and confirm they can identify their worst-performing product and lowest-stock SKU within 5 minutes.
Problem and target customer
Independent retail store owners track sales, inventory turns, and customer patterns across spreadsheets and disconnected POS exports, making it hard to quickly identify underperforming products or low-stock items before they cost revenue.
Solo or small-team independent retail shop owners who use Shopify POS or manual daily entry and need a focused analytics dashboard without building custom software.
Monthly SaaS subscription with usage-based add-ons for higher record processing volume.
Editorial note
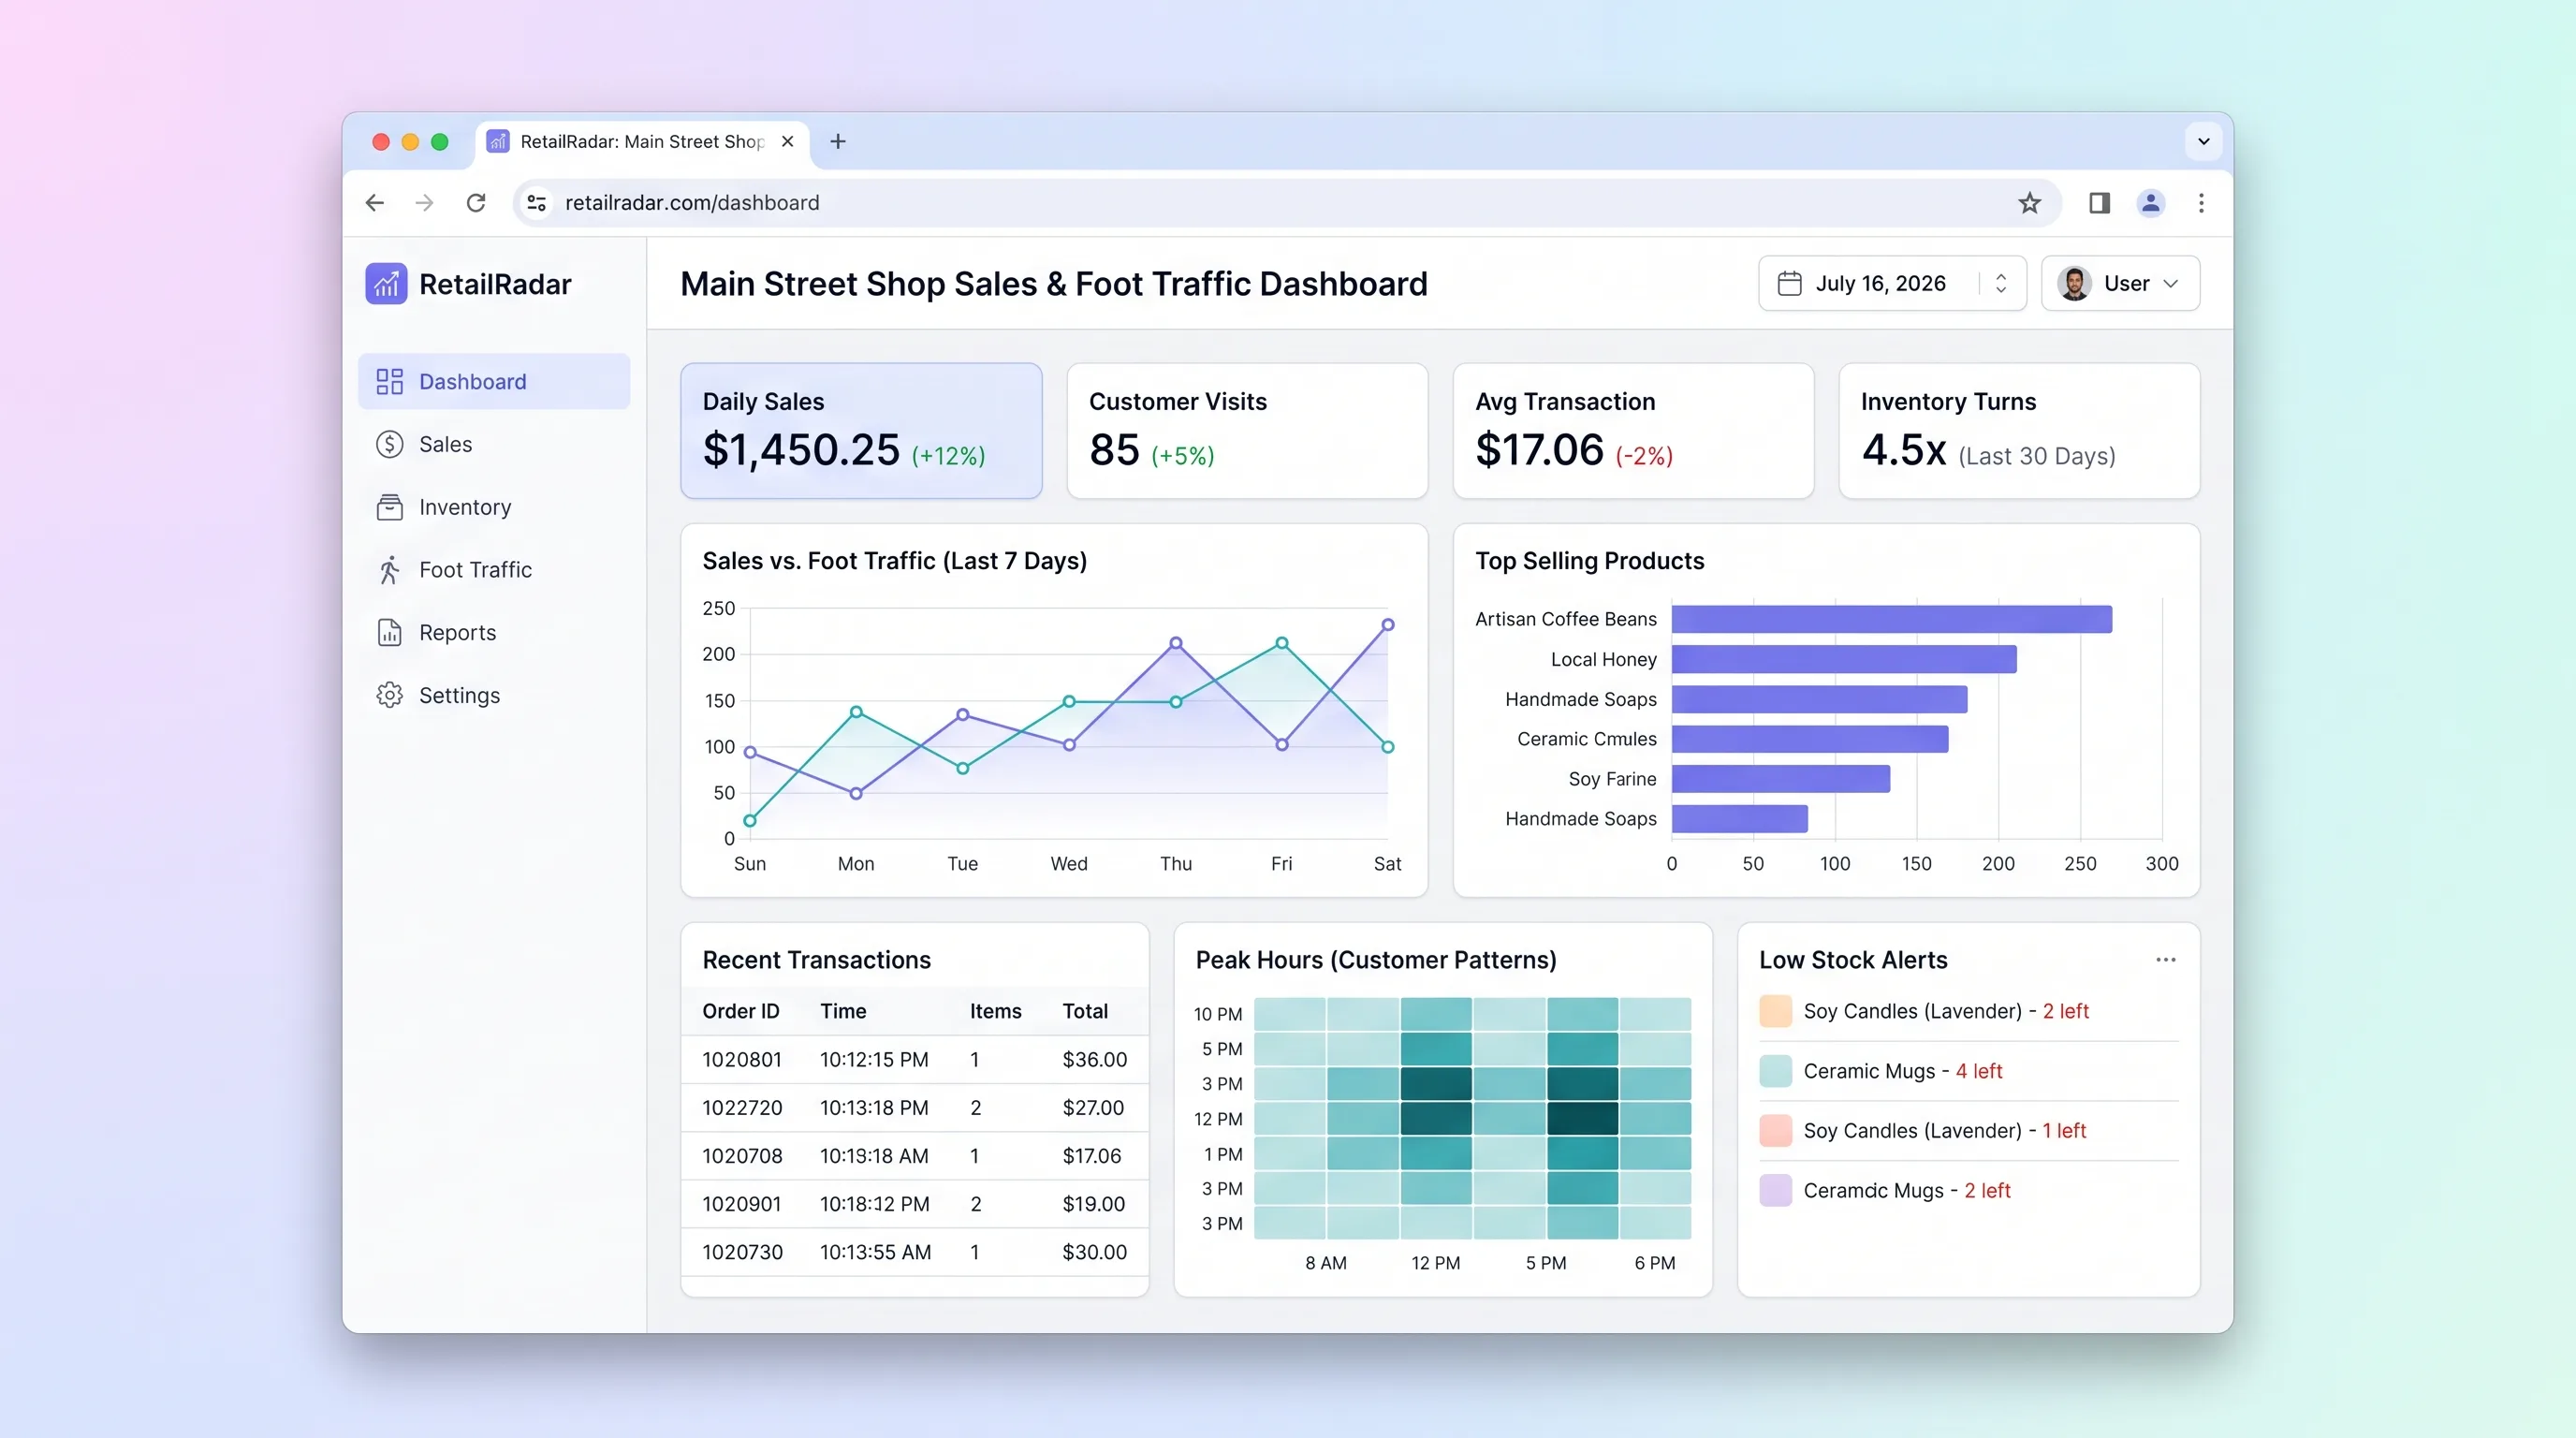
RetailRadar targets independent retail shop owners who currently juggle POS exports and spreadsheets to understand what is selling and what is running low. The MVP focuses on one workflow: import a month of sales data, immediately see best and worst performing days and products, flag low-stock SKUs, and set a revenue goal with progress tracking.
The first version accepts Shopify POS CSV exports and a manual daily entry form, avoiding the complexity of real-time POS API integration. A warm, approachable dashboard with a dark sidebar, cream and amber KPI tiles, and responsive charts keeps the experience focused for non-technical owners.
Weekly summary emails generated from an LLM reading aggregated sales data give owners a low-effort reason to return. SMS alerts and maps-based foot traffic visualization are deferred until beta usage confirms demand.
Choose your next step
Evaluate the operating tradeoffs quickly, or inspect how to build the MVP.
Compare the three operating paths at the default workload before opening the full calculator.
See cost preview Build this ideaInspect the build blueprintReview MVP scope, workflow, states, data rules, architecture, and acceptance criteria.
Open blueprintEvaluation preview
Directional infrastructure estimates for the current 400 orders assumption. Open the full calculator when you are ready to change it.
Managed app hosting, database, backups, and basic observability for the ecommerce workflow.
Lowest operating effortOne small VPS running the app, database, media volume, and backup job.
Lowest baseline costSeparate app, data, storage, and worker capacity for cleaner operations.
Most separation and controlBuild blueprint
Product goal
MVP scope
UX and user flow
Upload Shopify POS CSV or fill manual daily entry form
View KPI tiles, performance charts, and low-stock alerts
See best and worst performing days and products
Set monthly target and track progress
Core entity outline
Represents a single retail shop account
Stores one row of daily sales per SKU
Represents a product with inventory metadata
Monthly revenue target with progress tracking
Architecture and data flow
Accepts CSV uploads, validates fields, deduplicates SKUs, writes normalized rows to Supabase
Queries Supabase for KPI aggregates, product rankings, and goal progress
Calls OpenAI with aggregated weekly sales data to produce plain-language summary text
Make scenario that runs weekly, triggers insight generation, and sends transactional email
Deliverables and acceptance
Recommended stack
Generates the dashboard UI with dark sidebar, cream/amber KPI tiles, and Recharts-style charts from a structured prompt.
Provides PostgreSQL for sales records, SKUs, goals, and workspace auth without custom server code.
Schedules weekly summary email generation and triggers low-stock alert notifications from database changes.
Hosts any custom backend services or scheduled jobs that Supabase and Make do not cover natively.
Generates plain-language weekly summary insights from aggregated sales and inventory data.
Lovable builds the dashboard interface from the design spec. Supabase handles durable sales records, SKU indexing, and goal tracking. Make glues the weekly email and low-stock alert workflows. Railway hosts any edge services. OpenAI generates readable insight summaries from structured sales data.
Copy the build prompt, model the operating cost, and choose where to deploy.
Execution
Once the blueprint is clear, use the prompt, cost model, and deployment options to start building.
Build prompt
Lovable
Build prompt
Open the prompt pack whenever you are ready to take this blueprint into your builder.
Build prompt ready
Copy the prompt into your builder, then use the cost model below to choose how you want to run it.
Use the cost model to choose a deployment path that matches the build plan.
Cost calculator
A technical run-cost estimate for the first production version. Team, acquisition, payment fees, and business COGS are excluded.
$13-$33 per 200 orders
Low and high values allow for usage variance and plan headroom.
Managed app hosting, database, backups, and basic observability for the ecommerce workflow.
50K orders included, then $8-$20 per 100K ordersTransactional email is implied by the source workflow or feature list.
3K orders includedMaps API is implied by the source workflow or feature list.
1K orders includedThe estimate combines the selected infrastructure path, required operating modules, selected optional modules, and usage above included monthly allowances. Taxes and regional uplifts are excluded.
Deployment options
Choose based on operating preference, not only the headline price.
Fast Docker deployment for the app, database, worker, and preview workflow without managing a VPS.
Usage billing needs active monitoring as traffic and jobs grow.
Run the app, worker, and database on one small Vultr VPS with Docker Compose and explicit backups.
You own patching, backups, monitoring, and incident response.
Separate application, worker, data, storage, and backup responsibilities as the workload grows.
You own server setup, patching, backups, and operational monitoring.
Start building
Generate the dashboard with dark sidebar navigation, cream/amber KPI tiles for daily sales and inventory turns, low-stock alert cards, product performance ranking charts, and a revenue goal progress bar using Recharts-style components.
Open Lovable 02AutomationAutomate Weekly Summary and Low-Stock AlertsSchedule a weekly Make scenario that queries Supabase for the past week's sales and inventory data, sends the payload to OpenAI for insight generation, and dispatches a transactional email summary to the workspace owner.
Open Make 03DeployHost Import Processing ServiceDeploy a lightweight Node service on Railway that accepts CSV uploads, validates and deduplicates SKU records, and writes normalized rows to Supabase for dashboard queries.
Open RailwayKeep exploring
EcommerceRetail
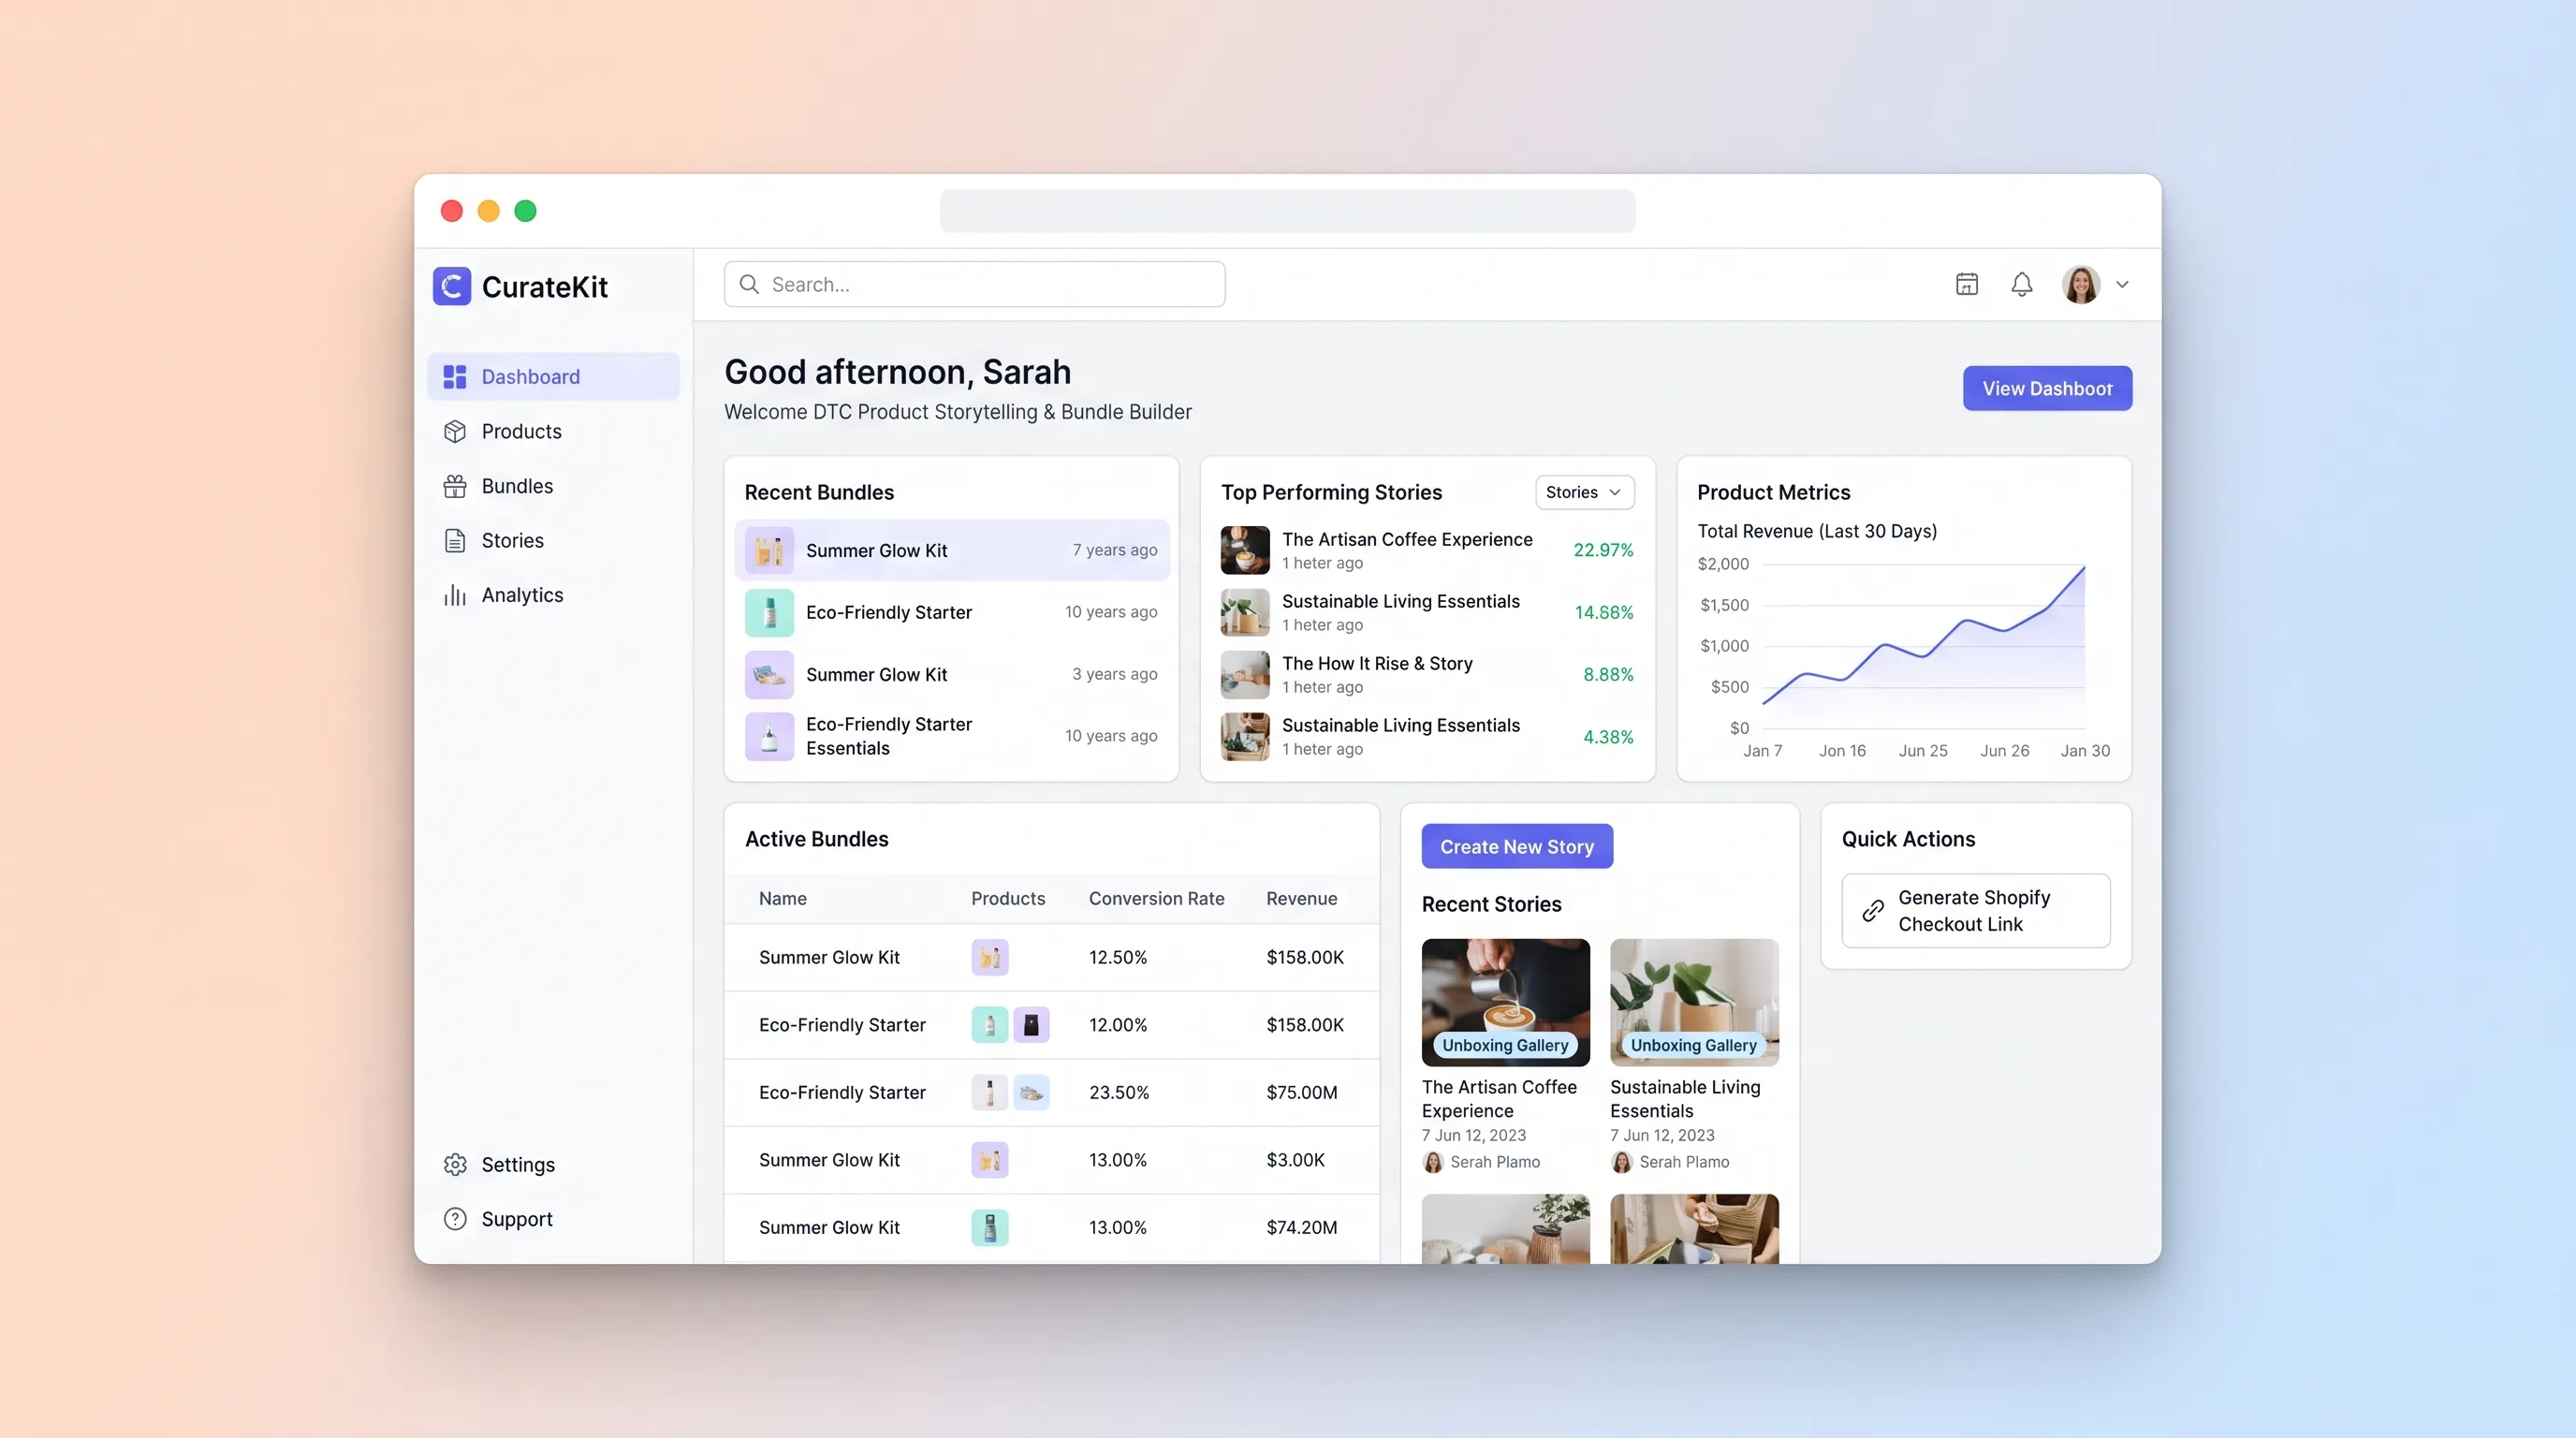
A no-code workspace where DTC brand owners assemble editorial product story pages with bundle configurators and UGC galleries, then publish Shopify-ready checkout links.
SaaS WorkflowCreator Economy & Media
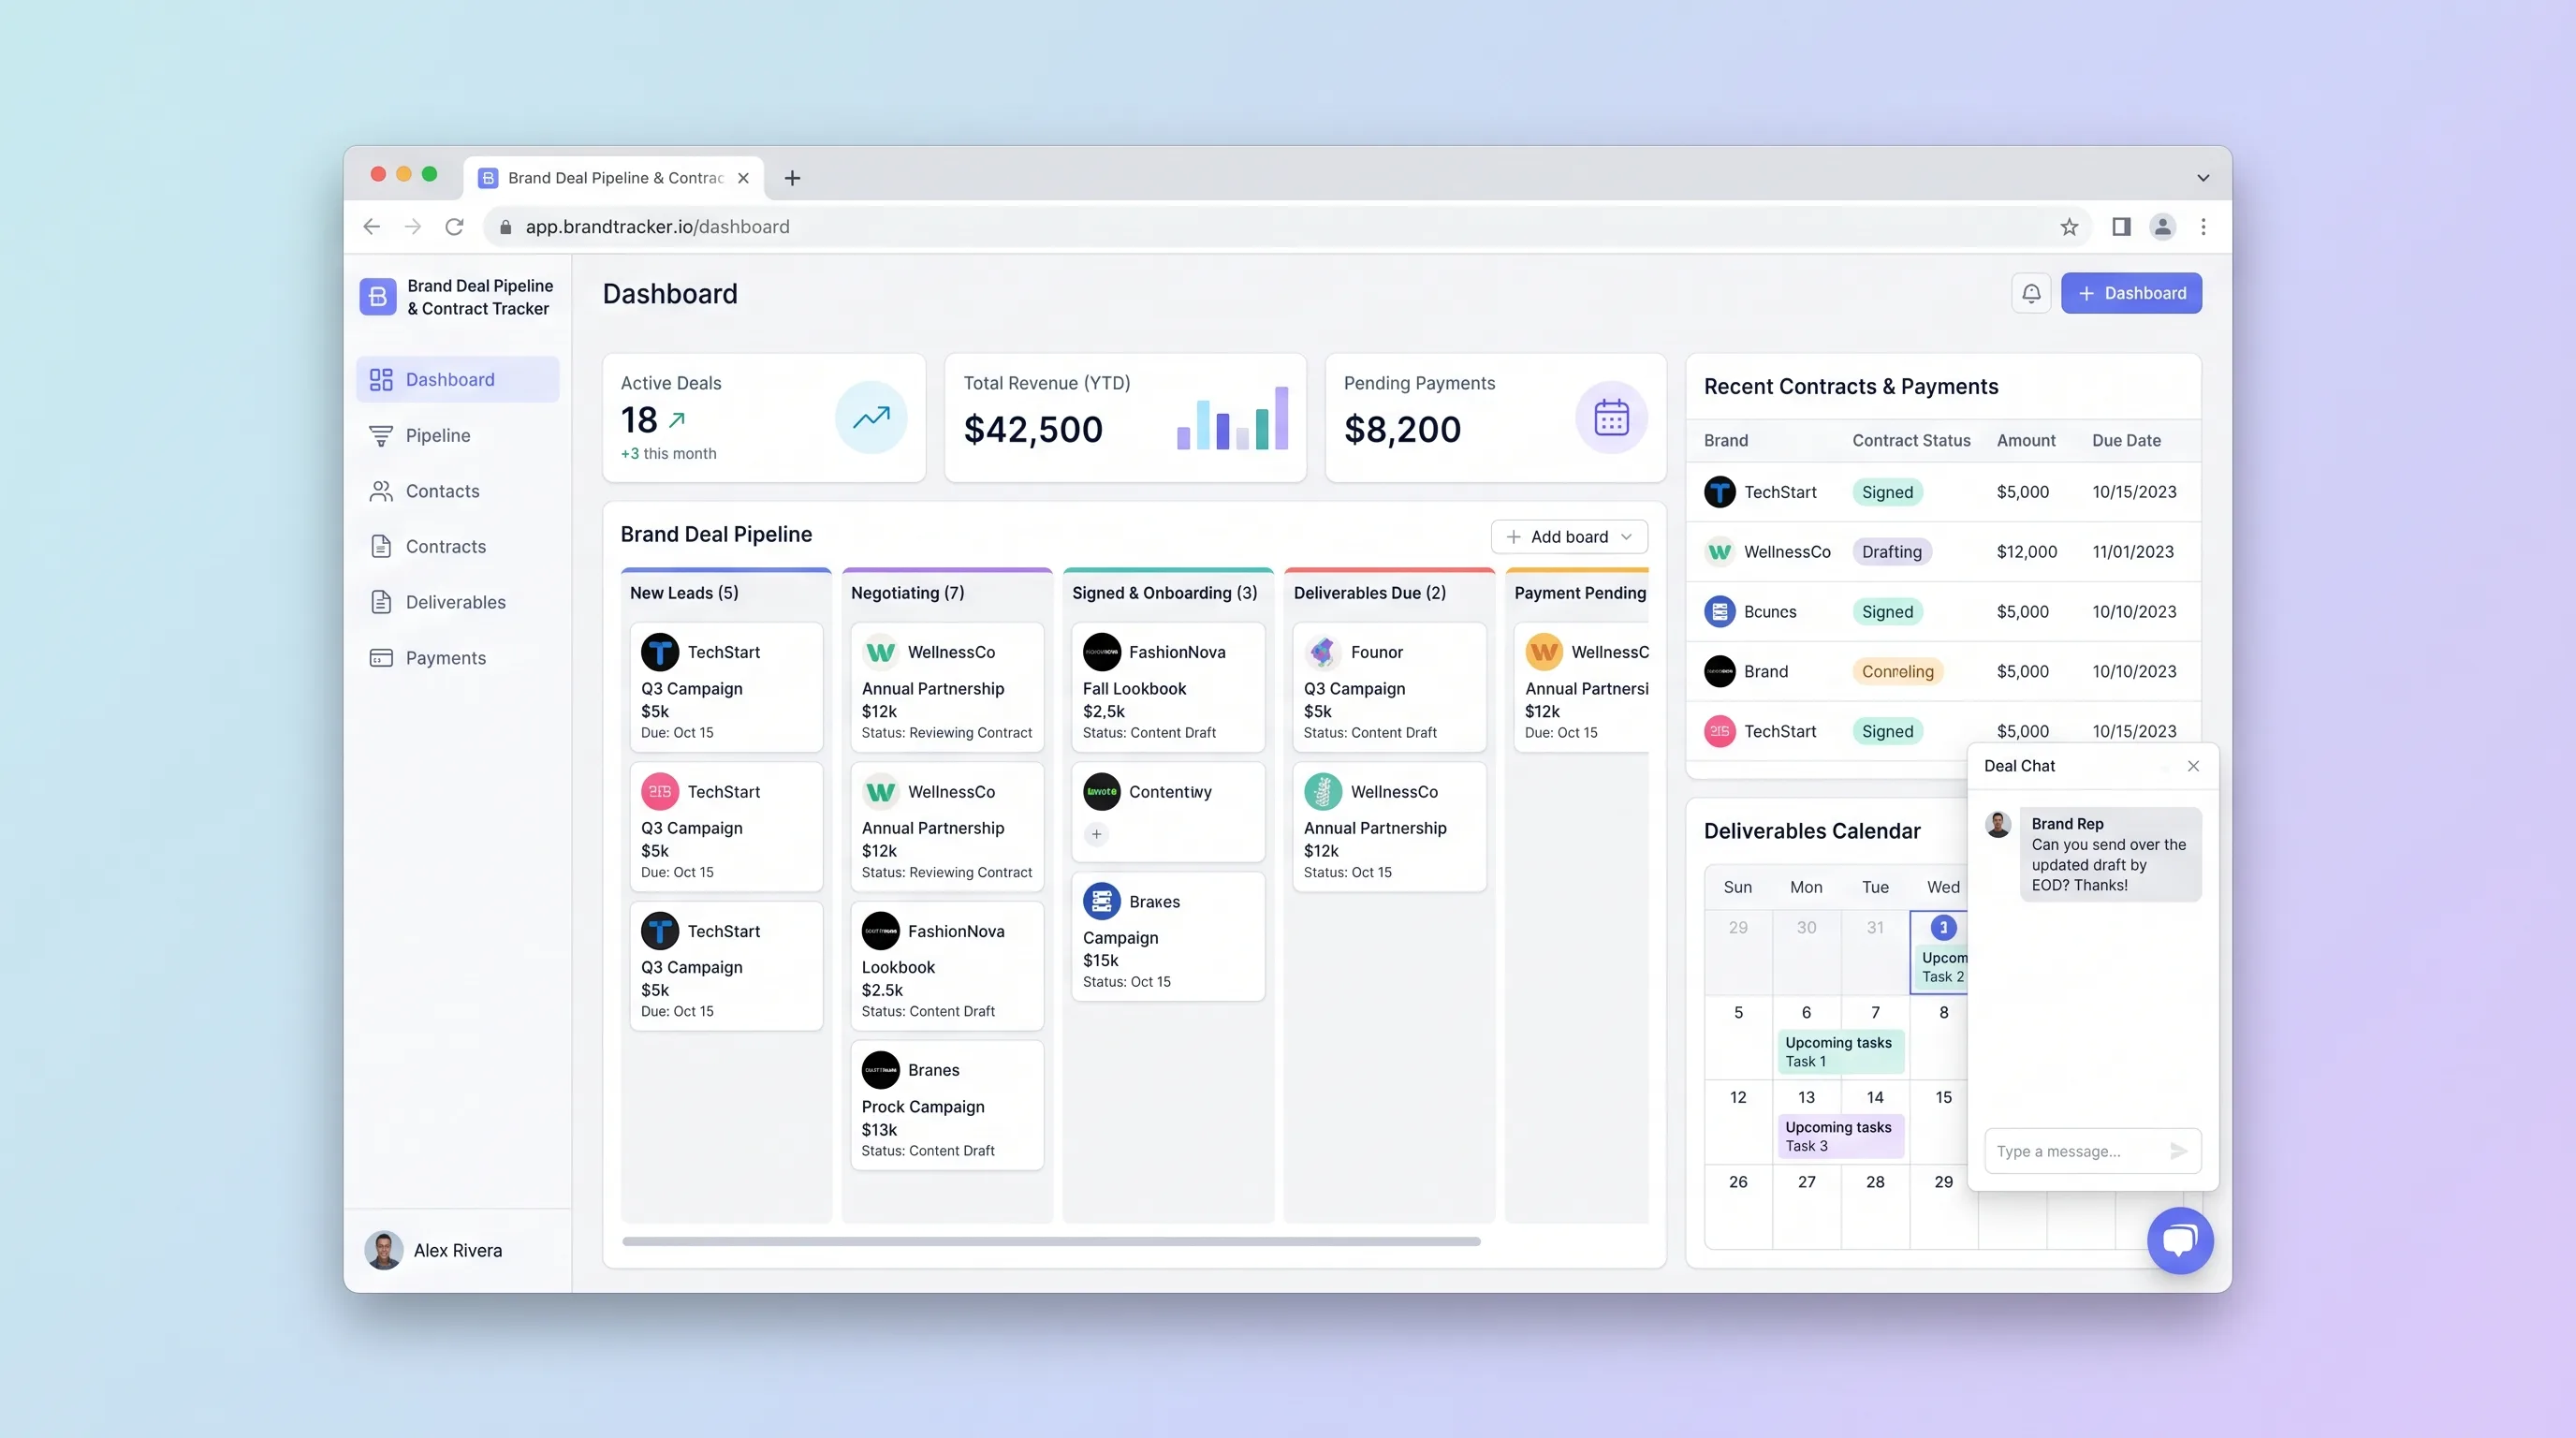
A focused CRM where solo influencers and small creator teams manage sponsorship leads from first pitch through signed contract, deliverable deadlines, and payment reconciliation.
AI ToolBusiness Operations
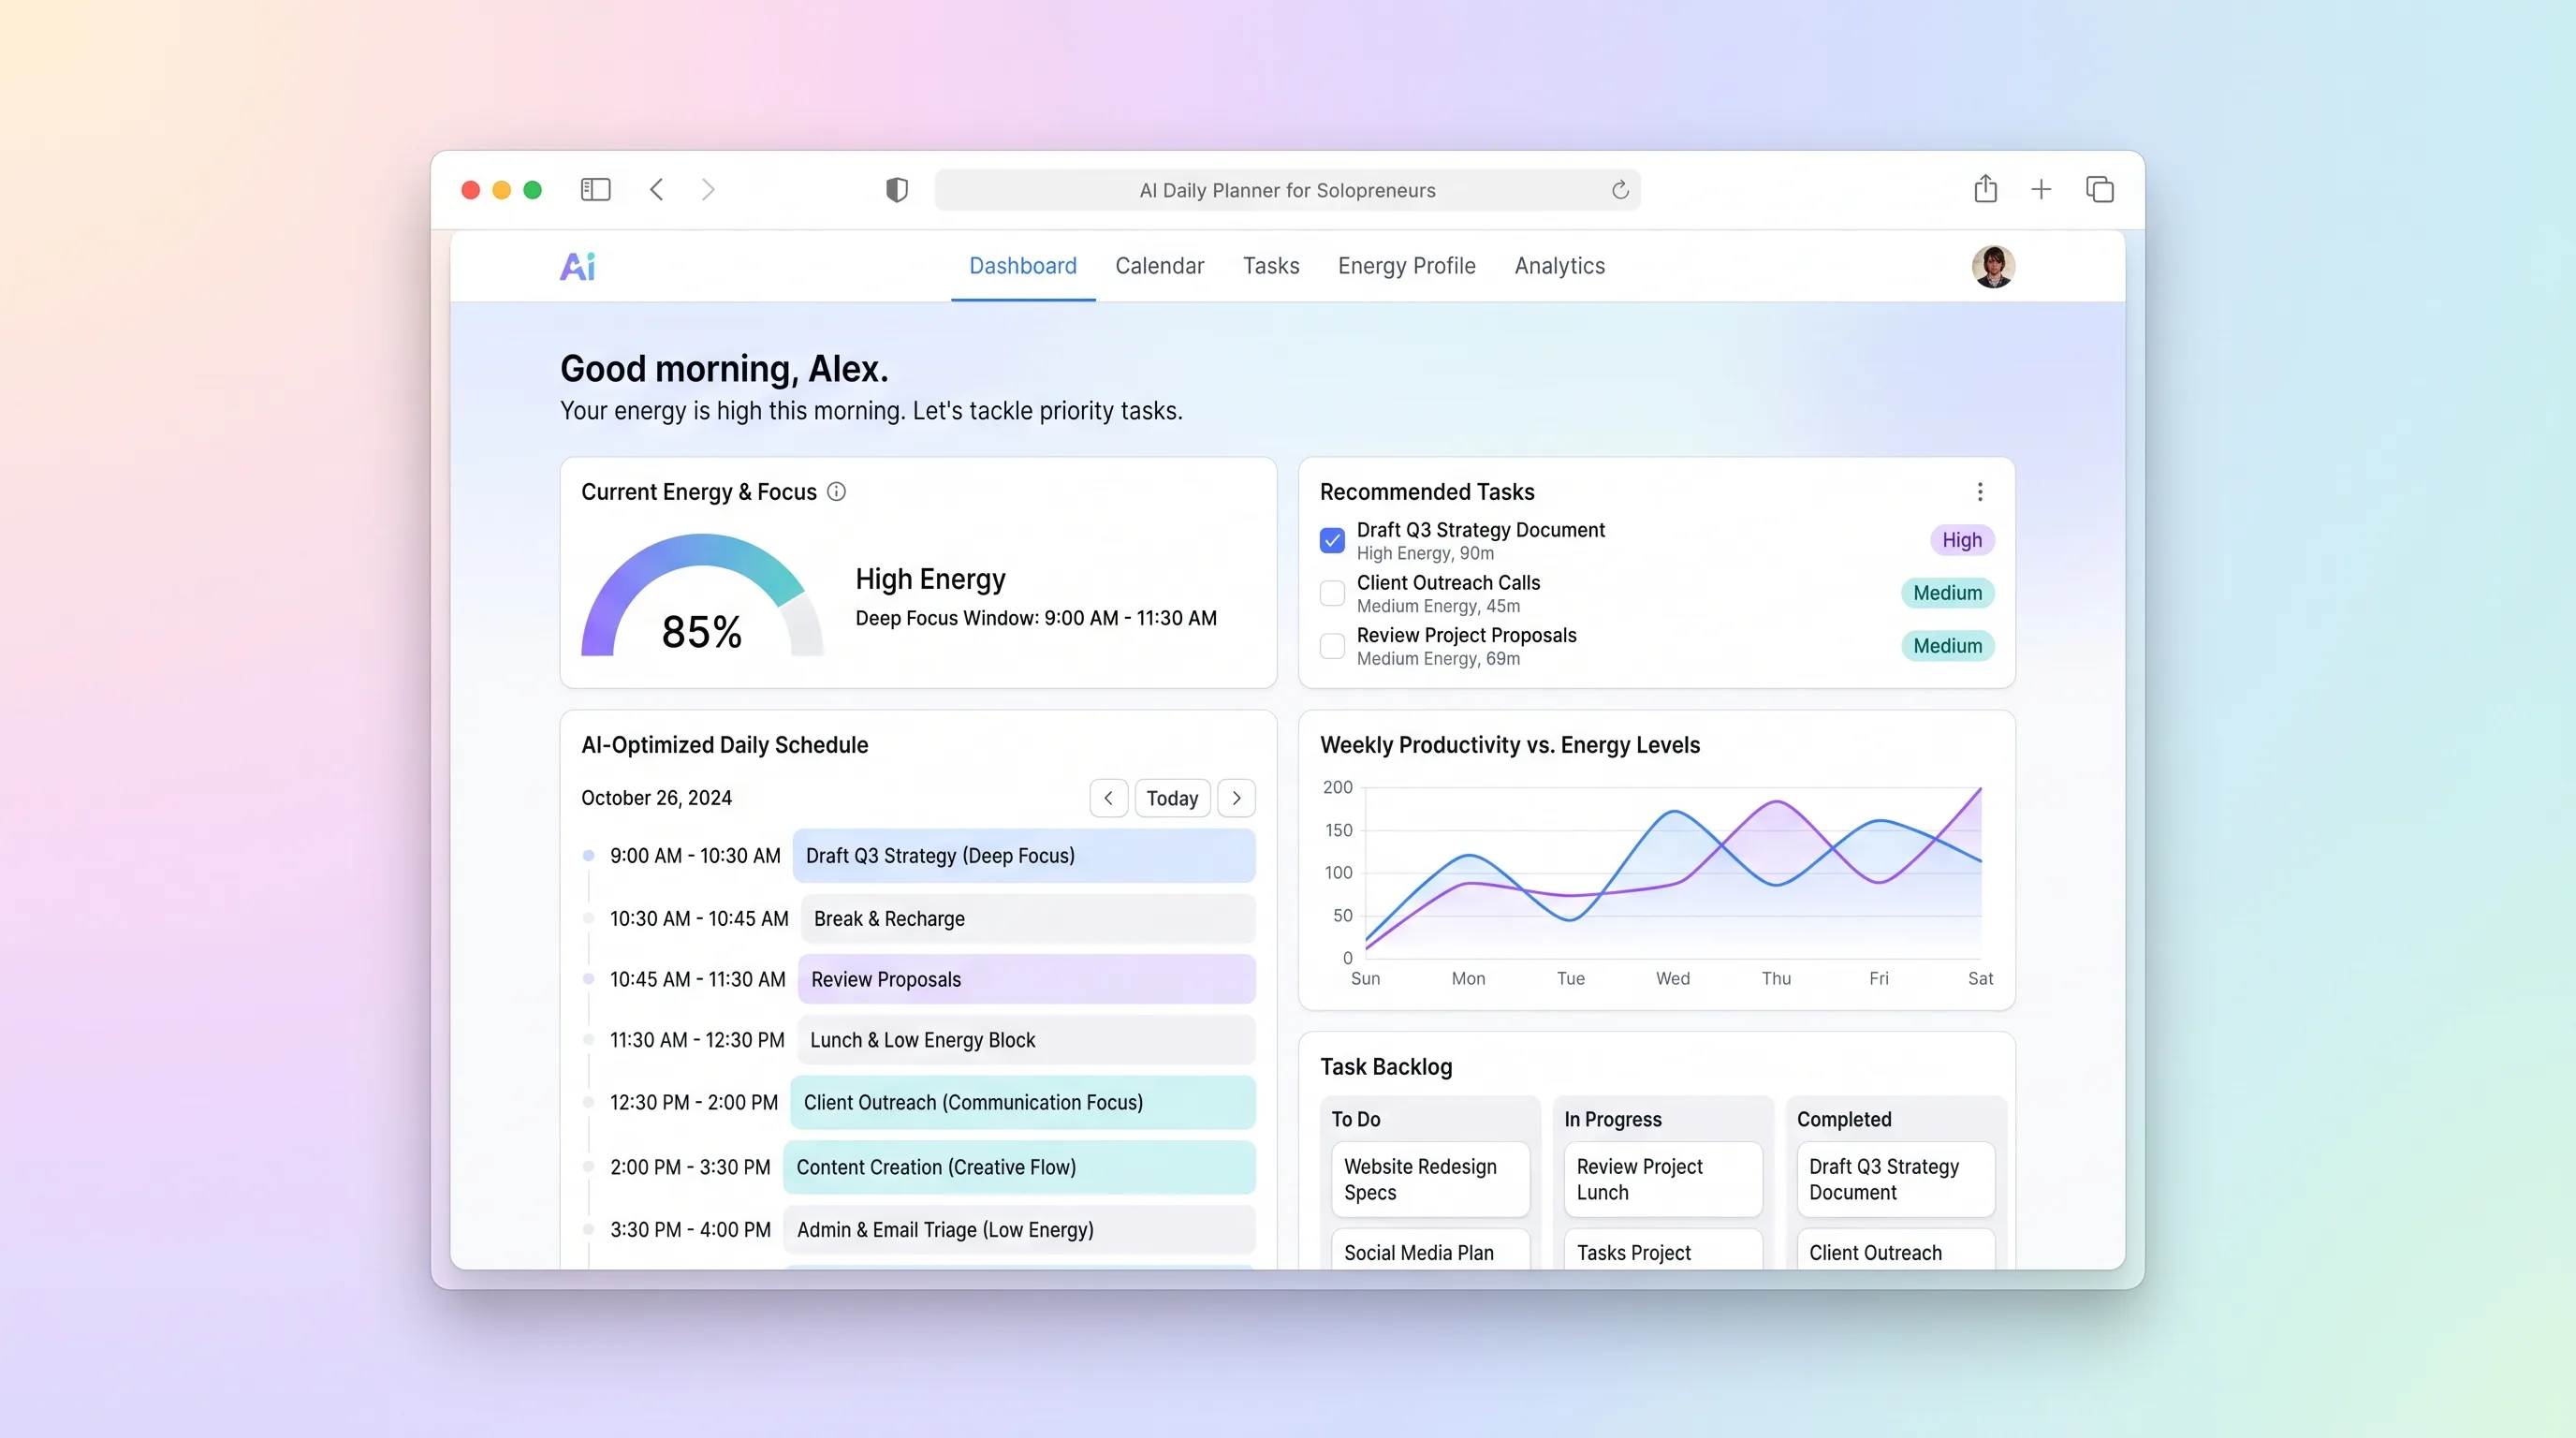
A daily planning tool that maps solopreneur tasks to personal energy windows using AI prioritization, calendar sync, and CSV import from existing task tools.
SaaS WorkflowBusiness Operations
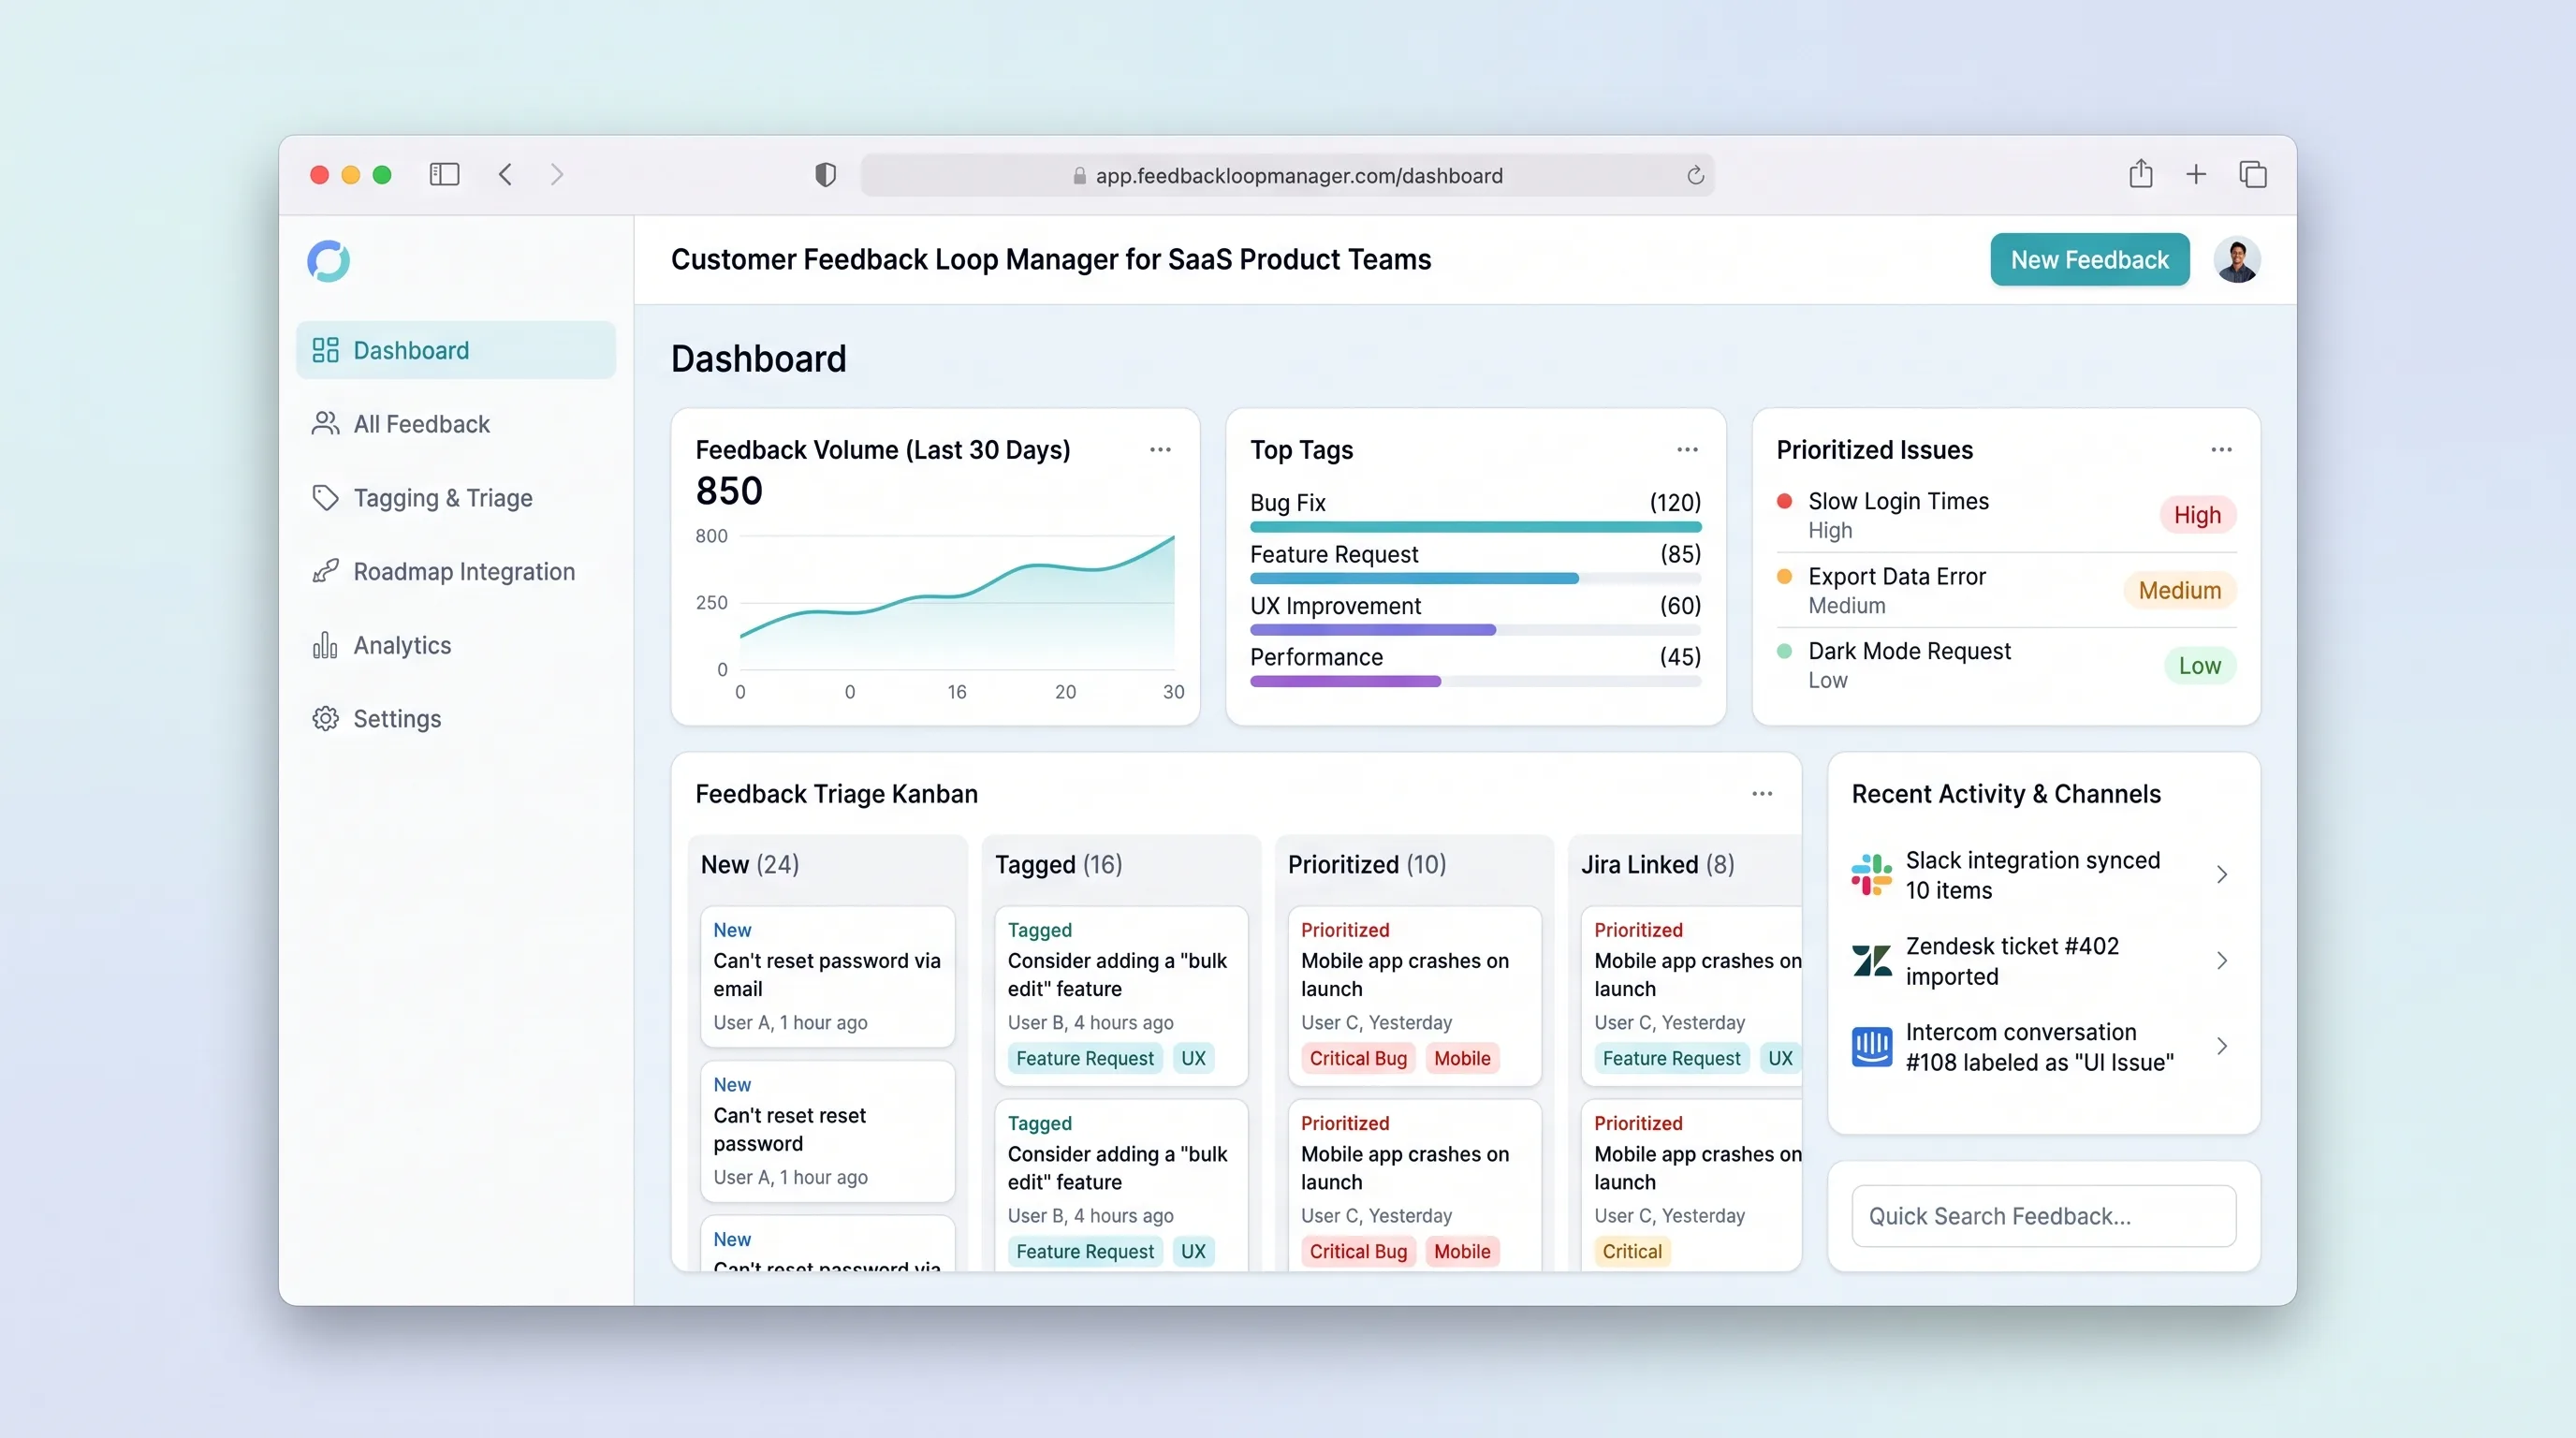
Collect, tag, and prioritize user feedback from multiple channels into a single prioritized backlog that feeds roadmap decisions with traceable evidence.
SaaS WorkflowSales & Marketing
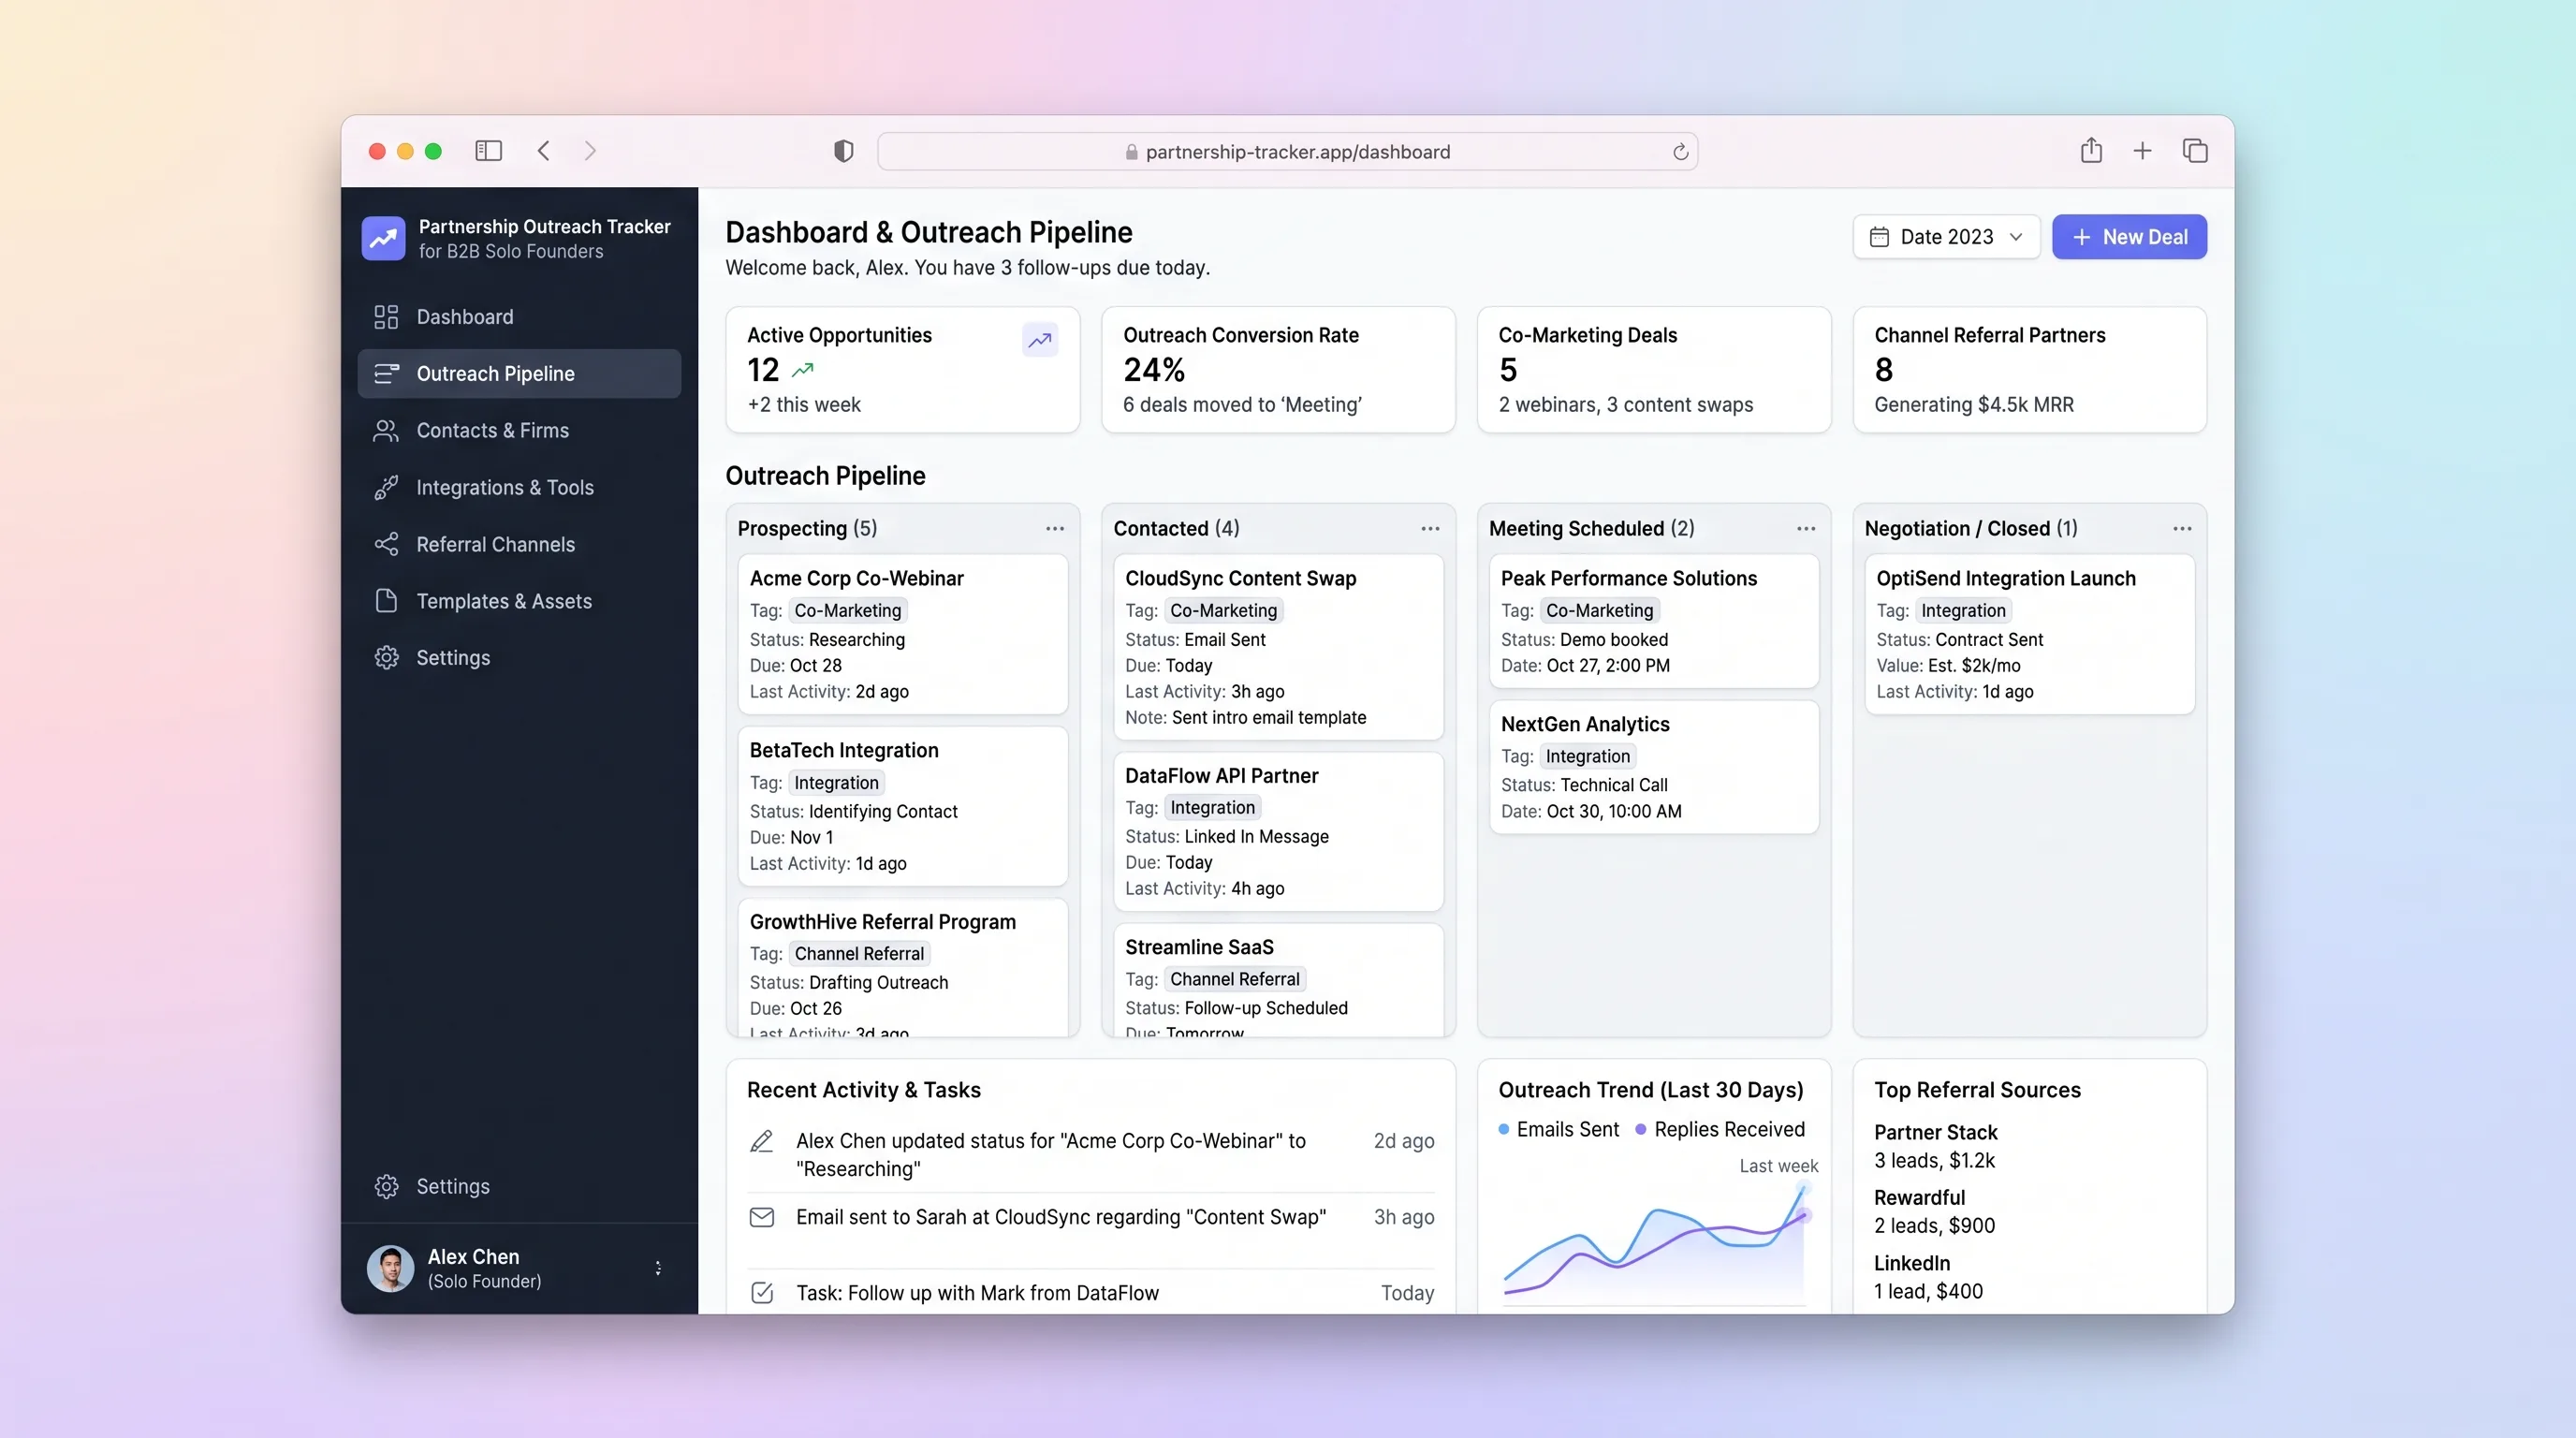
A single-workspace outreach tracker that lets a solo B2B founder run a 30-partner campaign, log email replies, schedule follow-ups, and close co-marketing or integration deals without juggling spreadsheets and Gmail.
SaaS WorkflowCreator Economy & Media
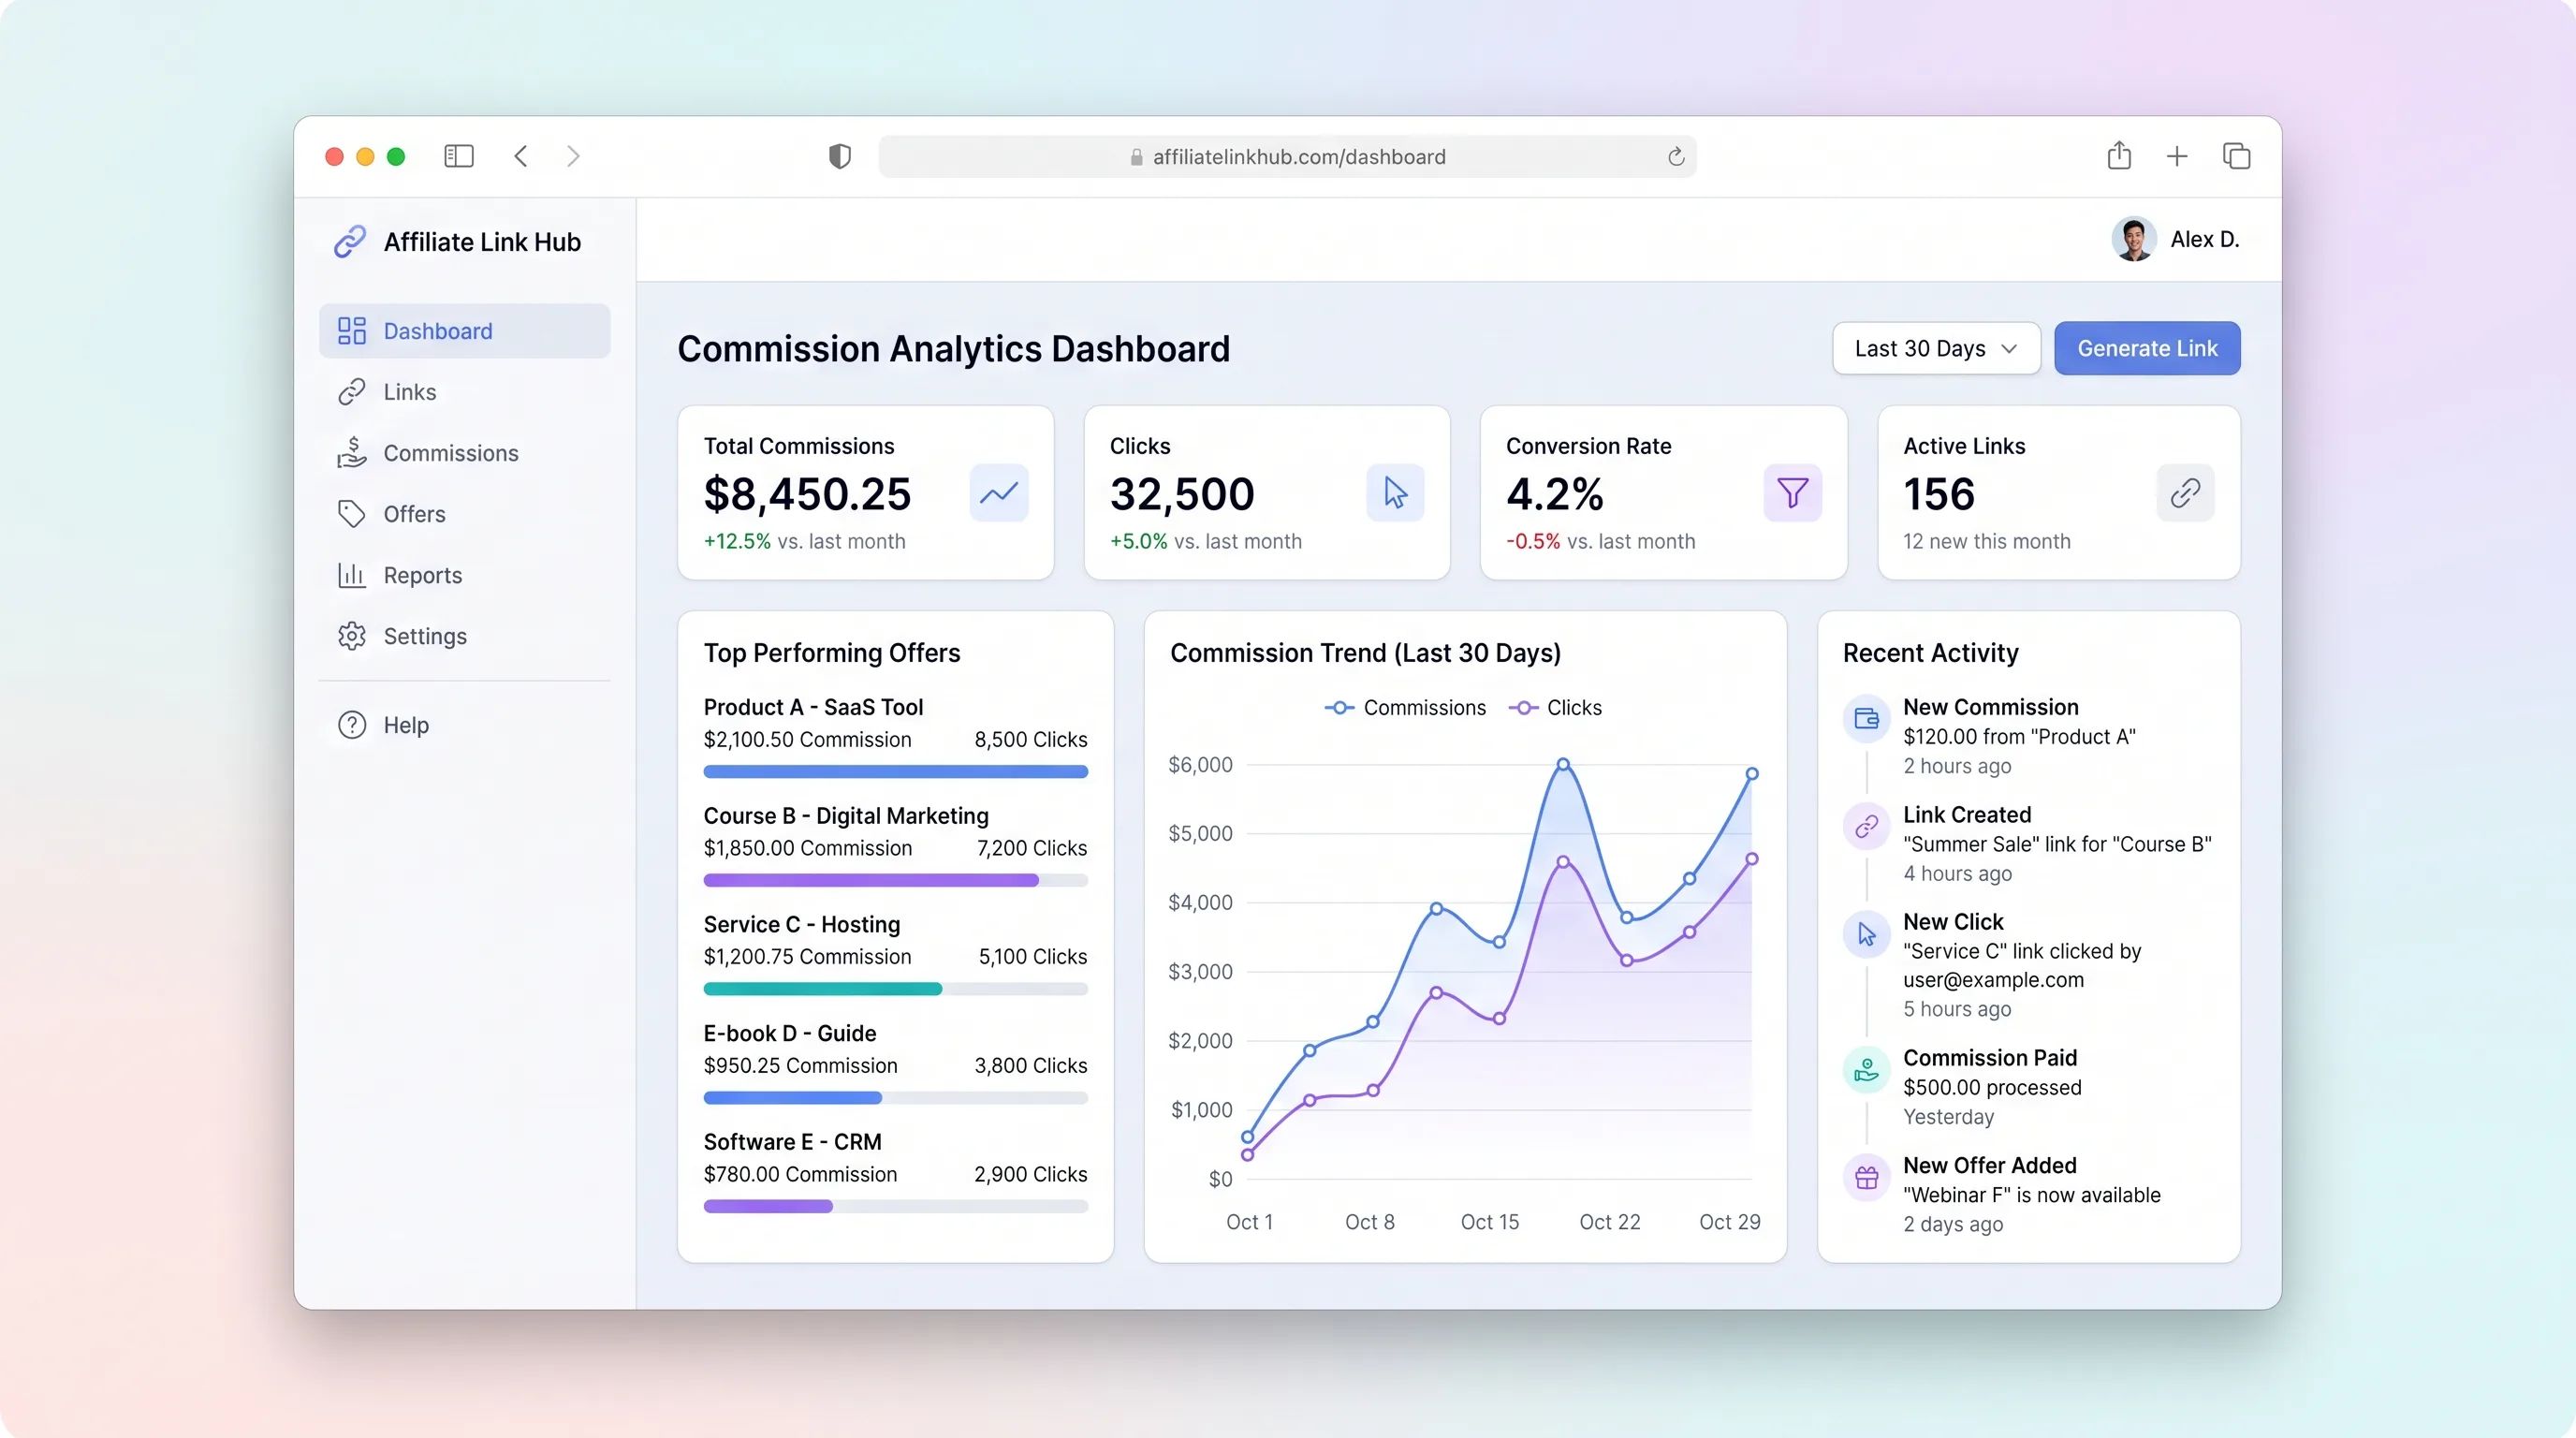
A focused workspace where creators import affiliate programs, distribute tracked links, monitor click and commission trends, and log payouts without juggling spreadsheets.